Welcome back, future Indian Statistical Service (ISS) officers!
We have arrived at a very special milestone. Today, we are officially wrapping up Module 2: Economic Statistics (The Money Part). Over the past few sessions, we have successfully decoded the nation’s wealth through GDP and National Accounts (Part 5), tracked the cost of living and inflation using CPI and WPI (Part 6), and measured the massive output of our factories and service sectors through ASI, IIP, ASUSE, and ASSSE (Part 7).
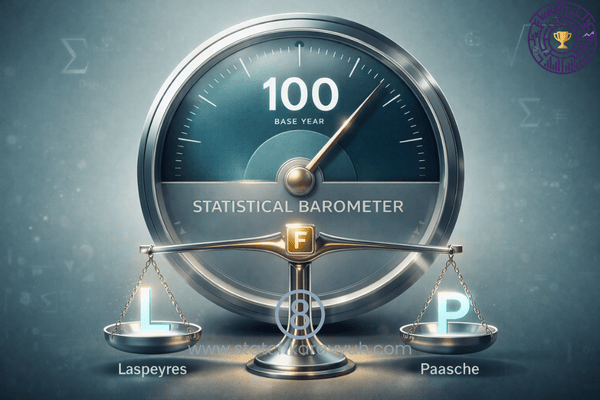
But if you look closely at all these economic indicators, whether it is the CPI, the WPI, or the IIP, they all share one common DNA. They are all expressed as a single number (like 120.5 or 175.2) compared to a “Base Year” value of 100.
How does the government compress the prices of thousands of commodities, ranging from a packet of salt to a luxury car, into one single representative number?
The answer lies in the beautiful mathematics of Index Numbers. Often called the “Economic Barometers,” Index Numbers are specialized averages designed to measure the relative change in a group of related variables over time, geographical location, or other characteristics.
For the UPSC ISS examination (specifically Statistics Paper II) and your interviews, the mathematics of Index Numbers is an absolute goldmine. The examiners love testing your deep conceptual clarity on different formulas, their inherent biases, and the mathematical “tests” they must pass. Let us mathematically decode the engine that drives India’s official statistics!
Step 1: The Foundation – Base Year and Weights
Before we apply any formula, we need two fundamental building blocks: a Base Year and a set of Weights.
1. The Base Year (P0,Q0) An index number always measures a “Current Year” against a reference point called the “Base Year.” For example, if the CPI base year is 2012=100, and today’s CPI is 180, it means prices have risen by 80% since 2012. According to official statistical guidelines, selecting a base year requires strict criteria:
- It must be a “Normal” year: The base year should be free from extreme economic abnormalities, wars, severe droughts, or massive price fluctuations.
- Synchronization: It should preferably synchronize with the period of major large-scale surveys (like the Household Consumer Expenditure Survey) so that accurate data is available.
- Not too distant: A base year from 1990 is useless today because consumer habits change. It must be updated periodically.
2. The Weighting Diagram You cannot give equal importance to 1 kg of rice and 1 kg of gold. Items must be weighted according to their relative importance in the consumer’s budget or total production. In CPI, these weights are derived from the Consumer Expenditure Survey (CES).
Step 2: The Heavyweight Formulas
Let P0 and Q0 be the Price and Quantity in the Base Year. Let P1 and Q1 be the Price and Quantity in the Current Year.
1. Laspeyres’ Index (The Base-Year Weighted Method)
This is the most famous formula in the world of official statistics. Formulated by Étienne Laspeyres, this method uses the Base Year Quantities (Q0) as weights.
Formula:
The “Upward Bias” (Crucial for Interviews): Laspeyres’ index is notorious for showing an upward bias (it tends to overestimate inflation). Why? Because of the human “substitution effect.” As prices of certain goods rise over time, consumers naturally shift to cheaper alternatives. However, because Laspeyres strictly uses the old base-year basket (Q0), it assumes you are still buying the same expensive quantities today, thus overestimating your true cost of living.
2. Paasche’s Index (The Current-Year Weighted Method)
Hermann Paasche took the opposite approach. He decided to use the Current Year Quantities (Q1) as weights.
Formula:
The “Downward Bias”: Unlike Laspeyres, Paasche’s index tends to show a downward bias (underestimating inflation). Because it uses the current basket (Q1), it heavily accounts for the fact that people have already shifted to cheaper goods, ignoring the loss of consumer welfare (the fact that you had to downgrade your lifestyle).
3. Fisher’s Ideal Index (The Masterpiece)
Irving Fisher decided to solve the bias problem by simply taking the Geometric Mean of the Laspeyres and Paasche indices.
Formula:
Why is it called “Ideal”? Because taking the geometric mean balances out the upward bias of Laspeyres and the downward bias of Paasche. More importantly, it passes the most rigorous mathematical tests of adequacy (which we will discuss next).
4. Marshall-Edgeworth Index
Instead of choosing between base or current year weights, this method uses the arithmetic average of both base and current year quantities (Q0+Q1) as weights.
Formula:
Step 3: Tests of Adequacy (The Ultimate Trial)
In the UPSC ISS exam, you will frequently encounter questions asking which formula satisfies which test. An index number formula is considered mathematically robust if it passes these tests:
1. The Unit Test This test requires that the index number should be completely independent of the physical units in which prices and quantities are quoted (e.g., liters, kilograms, meters).
- Fact: Almost all weighted indices (Laspeyres, Paasche, Fisher) pass this test. However, the Simple Unweighted Aggregative Index fails the Unit Test.
2. Time Reversal Test (TRT) This test checks for time consistency. It states that if you reverse the time periods (make the current year the base year, and the base year the current year), the product of the two indices should be unity (1).
- Formula:
- Passes: Fisher’s Ideal Index and Marshall-Edgeworth Index pass the TRT.
- Fails: Laspeyres and Paasche inherently fail the TRT.
3. Factor Reversal Test (FRT) This is a very strict test proposed by Fisher himself. It states that the product of the Price Index and the Quantity Index should be equal to the True Value Index (the ratio of total values).
- Formula:
- Passes: ONLY Fisher’s Ideal Index satisfies the Factor Reversal Test. (This is exactly why it is crowned as the “Ideal” index!).
- Fails: Marshall-Edgeworth, Laspeyres, and Paasche all fail the FRT.
4. Circular Test This is an extension of the Time Reversal Test for more than two periods. If you move from Year 0 to Year 1, Year 1 to Year 2, and then Year 2 back to Year 0, the product should be 1.
- Formula:
- Passes: Only the Simple Geometric Mean of price relatives and the Fixed Weight Aggregative method pass this test. Interestingly, even Fisher’s Ideal Index fails the Circular Test!
The Grand Indian Reality: Why Laspeyres Rules Them All?
Here is a brilliant conceptual question that the ISS Interview panel might ask you: “If Fisher’s Ideal Index is mathematically superior, balances out biases, and passes both TRT and FRT, why does the Government of India use the flawed Laspeyres formula for CPI, WPI, and IIP?”
The answer lies in administrative convenience and economic reality.
To calculate Fisher’s or Paasche’s index, you desperately need the Current Year Quantities (Q1) for every single month. Imagine the Field Operations Division (FOD) trying to conduct a massive nationwide Household Consumer Expenditure Survey every single month just to find out exactly how many kilograms of rice or liters of milk the entire population consumed that specific month. It is practically impossible, highly time-consuming, and unbelievably expensive.
Therefore, if we assume that the consumption pattern of a society remains relatively static over a short period, Laspeyres’ formula is the most convenient, fast, and economical method. We fix the weights (Q0) using a base-year survey, and then all the Ministry has to do every month is simply track the changing Prices (P1) from the markets.
This is exactly why the Index of Industrial Production (IIP) compiled by ESD, the Wholesale Price Index (WPI) compiled by the Office of Economic Adviser, and the Consumer Price Index (CPI) compiled by PSD all fundamentally rely on the Laspeyres formula!
Conclusion & What Lies Ahead?
Congratulations, future officers! You have successfully mastered Module 2: Economic Statistics. You now possess a deep, structural, and mathematical understanding of how the Indian state accounts for its money, its industries, its inflation, and the mathematical formulas powering these indicators.
However, India is deeply rooted in its soil. We cannot claim to understand the Indian Statistical System without understanding the sprawling, complex, and traditional mechanisms of measuring our farmlands and livestock.
Take a deep breath, because in our next stop, we are launching into Module 3: Agricultural Statistics. We will kick off with Part 8: Counting the Harvest – Crop Estimation (TRS, EARAS, ICS), where we will explore how village Patwaris and cutting-edge Remote Sensing satellites join forces to estimate India’s agricultural output!
Keep revising your formulas, memorize which tests Fisher passes, and we will see you in the fields of Module 3!
This article is part of our complete guide to Official Statistics for UPSC ISS. Bookmark the main guide for the full roadmap.
Thank you Sir
Thank you for reading!
Really happy it helped you.
Valuable content , hats off. Please never stop posting such content for us it’s highly appreciable.🤌
Thank you so much!
Comments like this genuinely encourage me to keep creating and posting more useful content.
I truly appreciate your support.
[…] In this blog, we have compiled the ultimate Formula Cheat Sheet. We will cover National Accounts, Vital Statistics, Employment (PLFS), and Index Numbers. […]
These blogs are really helpful in revising and fillig the gaps in the preparation. Also it is comprehensively covering the topics of Official Statistics for ISS.
Thank you! Glad the blogs are helping in your ISS preparation
[…] Congratulations! You have successfully conquered Module 2: Economic Statistics, where we decoded the complex mathematics of GDP, Inflation (CPI/WPI), Industrial Output (IIP/ASI), and the formulas of Index Numbers. […]