Welcome back, future Indian Statistical Service (ISS) officers!
Congratulations! You have successfully conquered Module 2: Economic Statistics, where we decoded the complex mathematics of GDP, Inflation (CPI/WPI), Industrial Output (IIP/ASI), and the formulas of Index Numbers.
Today, we take a massive shift in our journey. We are stepping out of the air-conditioned corporate factories and bustling urban markets, and walking straight into the heart and soul of India: The Agricultural Fields. Welcome to Module 3 of our new phase, Agricultural Statistics (Crop Estimation).
Agriculture is the backbone of the Indian economy, employing nearly half of our workforce. But imagine the sheer scale of the challenge: How does the Government of India accurately calculate the total production of wheat, rice, or sugarcane spread across millions of fragmented, tiny farms across 28 states? How do policymakers know in advance if we will have a bumper harvest or a severe food shortage?
The answer lies in a fascinating blend of traditional village administration (the Patwari system) and cutting-edge space technology (Remote Sensing). For the UPSC ISS exams and interviews, Agricultural Statistics is a highly scoring area. Let us mathematically and administratively decode how India counts its harvest!
The Golden Equation of Crop Production
Before we dive into the schemes, you must understand the most fundamental equation of Agricultural Statistics:
Total Crop Production = Area Sown × Average Yield per Hectare
To find out how much wheat India produced, you need to know two distinct things:
- Area: How many hectares of land were planted with wheat?
- Yield: What was the average output of wheat per hectare?
The Indian Statistical System has distinct machineries to calculate the “Area” and the “Yield”. Let us look at how the Area is estimated first.
Estimating the “Area”: The Tale of Two Systems (TRS & EARAS)
Historically, area statistics in India are extracted from village land records maintained by the local village accountant, commonly known as the Patwari. The Patwari conducts a field-to-field inspection every crop season to record what is grown on every patch of land. This complete enumeration is called Girdawari, and it is recorded in a village crop register called the Khasra Register.
However, waiting for the Patwari to count every single field in every single village of India takes too much time. By the time the data reaches Delhi, the crop has already been harvested and sold! To solve this time-lag, the government introduced two major sample-based schemes:
1. Timely Reporting Scheme (TRS)
- Where is it used? TRS is implemented in 16 land-record States (temporarily settled states) where the Patwari agency already exists.
- The Methodology: Instead of waiting for 100% of the villages to be counted, we select a random sample of 20% of the villages in the state.
- The Task: The Patwari is strictly instructed to complete the Girdawari (inspection) in these 20% sample villages on a “priority basis” by a specific date.
- The Output: This provides quick, advance estimates of the area under principal crops (broken down by irrigated/unirrigated and traditional/High Yielding Varieties). Over a period of five years, 100% of the state is eventually covered (20% each year).
2. Establishment of an Agency for Reporting Agricultural Statistics (EARAS)
- Where is it used? What happens in permanently settled states like Kerala, Odisha, and West Bengal, or in North-Eastern states like Arunachal Pradesh, Nagaland, Sikkim, and Tripura? These states simply do not have a traditional Patwari system to maintain updated land records!
- The Methodology: To fix this massive data gap, the government established EARAS. Under this scheme, a dedicated, full-time statistical agency is set up specifically for the collection of area and production statistics. The basic 20% sampling methodology remains exactly the same as TRS, but it is executed by this special statistical staff instead of traditional revenue Patwaris.
Estimating the “Yield”: General Crop Estimation Survey (GCES)
Now that we know the “Area”, how do we find the “Average Yield” (kilograms per hectare)? You cannot just look at a field and guess the weight of the crops. You have to physically cut the crop and weigh it.
This is done through the General Crop Estimation Survey (GCES), utilizing a highly scientific method called Crop Cutting Experiments (CCEs).
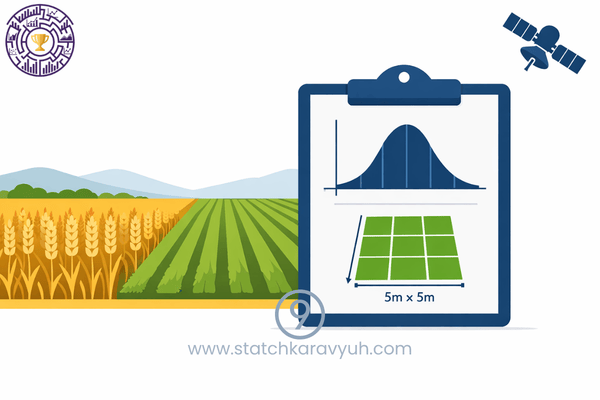
The Sampling Design (Memorize this for the ISS Exam!): The GCES adopts a Stratified Three-Stage Random Sampling design:
- Stratum: The Tehsil or Taluka.
- First Stage Unit (FSU): A Village within the Tehsil.
- Second Stage Unit (SSU): A specific Field growing the specified crop within that village.
- Ultimate Stage Unit (USU): A randomly marked Plot inside the field (usually 5 meters x 5 meters in size).
The Experiment: The field investigator goes to the randomly selected 5m x 5m plot, physically harvests the crop inside that boundary, dries it, and weighs the produce. These exact weights form the statistical baseline for estimating the yield rate of the entire state!
The Watchdog: Improvement of Crop Statistics (ICS) Scheme
We know from Module 1 that administrative data can be flawed. What if the Patwari sat under a tree and filled the Khasra register without actually visiting the fields? What if the crop cutting experiment was done poorly?
To ensure data integrity, the government runs the Improvement of Crop Statistics (ICS) scheme.
- The Auditor: Here, our very own NSO’s Field Operations Division (FOD) steps in as the independent auditor, working alongside the State Agricultural Statistics Authority (SASA).
- Physical Verification: Under ICS, FOD supervisors conduct sample checks on the primary fieldwork. They physically verify the Patwari’s area enumeration in approximately 5,000 villages, looking specifically at 4 clusters of 5 survey numbers each.
- CCE Supervision: FOD also independently supervises about 16,000 Crop Cutting Experiments at the harvest stage to ensure the weighing is perfectly accurate. They scrutinize the village crop abstract to check for totaling errors and delays.
The Calendar: Releasing the Crop Forecasts
Agriculture is highly sensitive to markets and food security. Therefore, the Directorate of Economics & Statistics (DES) under the Ministry of Agriculture releases estimates in phases during the Agricultural Year (July-June):
- First Advance Estimate (September): Covers only Kharif (monsoon) crops, largely based on visual observations.
- Second Advance Estimate (February): Covers Kharif and Rabi (winter) crops, integrating inputs from field reports and remote sensing.
- Third Advance Estimate (April-May): Firms up earlier estimates and incorporates better yield data for Kharif.
- Fourth Advance Estimate (July-August): Based on firm figures of yield rates obtained through the finalized GCES Crop Cutting Experiments.
- Final Estimates (December): Released at the end of the calendar year.
🔥 Interview Focus: Modernization & Remote Sensing (FASAL)
If you are sitting in the UPSC ISS Interview in 2026 or 2027, you cannot just talk about Patwaris. You must talk about Space Technology and Mobile Apps!
1. FASAL (Forecasting Agricultural output using Space, Agro-meteorology and Land based observations):
To provide forecasts much earlier than the Patwari system, the government launched FASAL. It integrates multiple high-tech agencies:
- India Meteorological Department (IMD): Uses weather models to forecast yields mid-season.
- Institute of Economic Growth (IEG): Develops econometric models for pre-sowing forecasts.
- Space Application Centre (SAC) & NRSC: Provide cutting-edge satellite and remote sensing imagery to estimate crop coverage.
- MNCFC: All these inputs are sent to the Mahalanobis National Crop Forecast Centre (MNCFC) (established in 2012 by the Ministry of Agriculture) to validate the official conventional estimates.
2. The Digital Transformation of FOD:
MoSPI’s Field Operations Division has completely discarded paper schedules for crop statistics!
- Agrisoft: FOD has developed an Android-based application software named “Agrisoft” (written in Python/Android) on the Generalised Survey Solutions (GSS) platform for digital sample checks on area enumeration (Schedule AS 1.0).
- DGEs App: For the supervision of Crop Cutting Experiments (Schedule AS 2.0), FOD now uses the DGEs mobile app to digitally supervise and transmit harvest data in real-time, completely geo-tagging the farmer’s field.
Conclusion & What Lies Ahead?
To summarize:
- TRS & EARAS tell us how much land is being farmed.
- GCES & CCEs tell us how much crop each hectare yields.
- ICS acts as the supreme audit to ensure no one is manipulating the data.
- FASAL & Agrisoft represent the futuristic, digital transformation of this entire process.
By combining the sweat of the village Patwari with the high-tech eyes of ISRO satellites, the Indian Statistical System successfully counts the harvest that feeds 1.4 billion people!
But crops are only one half of the rural story. Who counts the farmers themselves? And how do we count India’s massive population of cows, buffaloes, sheep, and poultry?
In our next blog, Part 10: The Census of Land & Animals, we will decode the massive decennial and quinquennial exercises known as the Agriculture Census and the Livestock Census. We will explore why these two censuses cannot be conducted simultaneously and how they shape India’s rural policy!
Keep revising the Stratified Three-Stage sampling design, remember the role of MNCFC, and we will see you in Part 10!
This article is part of our complete guide to Official Statistics for UPSC ISS. Bookmark the main guide for the full roadmap.
[…] reached the grand finale of Module 3: Agricultural Statistics. In our previous session (Part 9), we walked through the fascinating fields of India, learning how the government estimates the area […]
[…] (Module 1), how GDP and Inflation are calculated (Module 2), how we estimate crops and livestock (Module 3), and how we track human population, vital rates, and employment through the mighty PLFS (Module […]
[…] and the NSO. In Module 2, we chased the money, decoding GDP, Inflation, and Industrial output. In Module 3, we walked through the agricultural fields to count crops and […]