Welcome back, future Indian Statistical Service (ISS) officers!
You have been making fantastic progress. In our previous session (Part 6), we completely updated our knowledge on how inflation is measured using the CPI and WPI, and we noted the massive statistical shift happening across the country with the introduction of the new 2022-23 base year.
But a nation’s economic pulse is not just about what consumers buy or what things cost; it is heavily defined by what its factories produce, what its small unorganized businesses earn, and how its massive service sector performs. Manufacturing and services are the twin engines of the modern Indian economy.
How does the government know if our factories are booming? How do we measure the output of millions of unorganized street vendors or booming service enterprises?
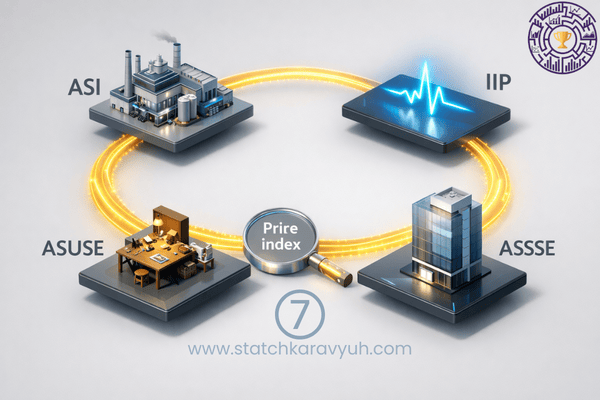
To answer these questions, the Indian Statistical System relies on massive pillars of industrial and enterprise data. Today, we are going to explore the Annual Survey of Industries (ASI), the Index of Industrial Production (IIP), and the highly crucial modern additions: ASUSE (Annual Survey of Unincorporated Sector Enterprises) and ASSSE (Annual Survey of Service Sector Enterprises).
Let us break down the exact methodologies and recent base year updates you need for your exams!
Meet the Architects: NSO Divisions and the Labour Bureau
Before we jump into the concepts, let us reconnect with the administrative blueprint we built in Module 1. Industrial and enterprise data is not compiled by a single division; it is a massive collaborative effort.
- Economic Statistics Division (ESD): Operating under the NSO, this division is responsible for compiling and releasing the Index of Industrial Production (IIP) every month.
- Enterprise Survey Division (EnSD): This is the powerhouse of business data. EnSD has the overall responsibility for planning, designing, processing, and publishing the data collected through the Annual Survey of Industries (ASI), ASUSE, and ASSSE.
- Field Operations Division (FOD): You cannot collect data sitting in Delhi or Kolkata! The FOD acts as the primary army that conducts the actual field surveys, visiting factories, local shops, and service centers to collect the required schedules.
- The Labour Bureau: While MoSPI handles the economic data of factories, the Labour Bureau (under the Ministry of Labour and Employment) is responsible for processing the labour-related data (like absenteeism, labour turnover, and earnings) collected specifically during the ASI.
Now that we know the players, let us look at the massive statistical products they manage.
1. Annual Survey of Industries (ASI): The Detailed X-Ray of Organized Manufacturing
If you want a complete, comprehensive, and in-depth health check-up of India’s manufacturing sector, you look at the Annual Survey of Industries (ASI). It is the principal source of long-term industrial statistics in India.
Legal Backing & Coverage: Because factories deal with highly sensitive financial data, they will not share it voluntarily. Therefore, ASI is conducted annually under the strict statutory powers of the Collection of Statistics (CoS) Act, 2008. However, the ASI does not cover every small shop on the street. It strictly covers the organised manufacturing sector. This includes all factories registered under Sections 2m(i) and 2m(ii) of the Factories Act, 1948, as well as Bidi and Cigar manufacturing establishments, electricity, gas, and water supply undertakings.
The ASI Schedule (A Two-Part Tale): The data is collected through a very detailed schedule divided into two parts:
- Part-I: Processed by EnSD in Kolkata. It collects hardcore economic data: assets, liabilities, employment, receipts, expenses, inputs, products manufactured, and Gross Value Added (GVA).
- Part-II: Processed by the Labour Bureau. It collects data on labour statistics, including man-days worked, absenteeism, labour turnover, and man-hours worked.
Sampling Design: ASI data collection uses a highly structured design divided into two parts:
- Census Sector: Here, all the units (100% of large factories) are surveyed completely.
- Sample Sector: The remaining smaller units are arranged by size and sampled using a Circular Systematic Sampling technique. These samples are further divided between the Central Sample (surveyed by NSO’s FOD) and the State Sample (surveyed by State/UT governments).
2. Expanding the Horizon: ASUSE and ASSSE
Here is a critical problem that ISS aspirants must understand: The ASI only covers the organized manufacturing sector. But what about the millions of unregistered local shops, weavers, and small repair units? What about the booming service sector (IT, banking, tourism) which contributes to over 50% of India’s GDP?
For years, the unorganized non-agricultural segment and the service sector suffered from an irregular flow of current data, forcing the National Accounts Division (NAD) to rely on indirect estimation methods. To fix this massive data gap, MoSPI introduced two revolutionary surveys under the Enterprise Survey Division (EnSD).
A. ASUSE (Annual Survey of Unincorporated Sector Enterprises)
Launched in 1st October 2019, ASUSE is exclusively devoted to ‘Unincorporated Non-agricultural Establishments’.
- Target: It captures the massive informal and unorganized sector of the economy that is not registered under the Companies Act or Factories Act.
- Data Collected: ASUSE collects rich, detailed data on the operational and economic characteristics of these small businesses. This includes data on Gross Value Added (GVA), fixed assets, employment, remuneration, and Information and Communication Technology (ICT) usage.
B. ASSSE (Annual Survey of Service Sector Enterprises)
While manufacturing has ASI, the service sector previously lacked a dedicated annual survey of this scale. ASSSE was introduced to specifically track the pulse of India’s service economy.
- Target: It maps the economic activity of enterprises operating strictly within the service sector.
- Data Collected: ASSSE tracks key metrics like outstanding loans, capital formation, employment, labour costs, fixed assets, and Gross Value Added (GVA).
Both ASUSE and ASSSE are absolute game-changers for the Indian Statistical System because they allow the government to calculate the GDP and National Income with much higher accuracy.
🔥 Current Affairs Impact: In the newly released 2022-23 GDP Base Year series, the government has made a monumental shift. Instead of relying on proxy indicators or inter-survey growths, the National Accounts Division now heavily utilizes the direct annual results of ASUSE and PLFS to accurately measure the household and quasi-corporate sectors every single year!
3. Index of Industrial Production (IIP): The Quick Pulse
While ASI, ASUSE, and ASSSE give detailed annual MRI scans of the economy, the government cannot wait over a year to know if the economy is crashing. Policymakers need a quick, monthly pulse rate. That is the Index of Industrial Production (IIP).
Compiled by the Economic Statistics Division (ESD), the IIP is a short-term, composite indicator that measures the changes in the volume of production of a basket of industrial products during a given period with respect to a chosen base period.
Key Facts for ISS:
- Base Year: The current base year for IIP is 2011-12.
- Release Date: It is released as “quick estimates” on the 12th of every month (with a lag of 6 weeks).
- Formula Used: The IIP is compiled using the classic Laspeyres’ formula.
Sectoral Composition (The 3 Pillars): The IIP covers three broad sectors. Under the Old 2011-12 Series, You must memorize their exact weights:
- Manufacturing: Carries a massive 77.633% weight (Data supplied by DPIIT covering 405 item groups).
- Mining: Carries a 14.373% weight (Data supplied by the Indian Bureau of Mines, Nagpur).
- Electricity: Carries a 7.994% weight (Data supplied by the Central Electricity Authority).
Use-Based Classification: Apart from sectors, IIP is also classified based on how the goods are ultimately used: Primary Goods (34%), Intermediate Goods (17%), Consumer Non-durables (15%), Consumer Durables (13%), Infrastructure/Construction Goods (12%), and Capital Goods (8%).
🔥 Interview Focus: The Index of Eight Core Industries Before the IIP is released, the Office of the Economic Adviser (OEA) releases the Index of Eight Core Industries. Why? Because these 8 industries alone constitute a whopping 40.27% of the total weight in the IIP. These industries are: Petroleum Refinery (highest weight at 28.04%), Electricity, Steel, Coal, Crude Oil, Natural Gas, Cement, and Fertilizers (lowest weight at 2.63%). If the core industries grow, the IIP will almost certainly follow!
The Ultimate Showdown: ASI vs IIP
As an ISS officer, you will frequently notice a confusing phenomenon: The growth rate shown by the ASI often differs significantly from the growth rate shown by the IIP for the exact same year. When the media asks you why, here is the technical explanation you must provide:
- Value Added vs. Volume: ASI growth is derived on the basis of Value Added (Output minus Input). IIP strictly measures the physical Volume of Production, irrespective of price changes.
- Dynamic Frame vs. Fixed Basket: ASI is a record-based survey capturing information on new items and new factories. IIP relies on a fixed set of items and factories chosen in the base period.
- Sample Size and Coverage: ASI covers both large and smaller units. Because smaller units operate on a small base, they often register higher growth. IIP is based on a much smaller, restricted sample of generally larger factories.
(Advanced GDP Integration Note: In the new 2022-23 GDP series, the government has discontinued the “Single Deflation” method for manufacturing. Utilizing high-quality data, the National Accounts now apply Double Deflation for the Manufacturing sector, significantly improving the accuracy of measuring industrial value added!)
Conclusion & What Lies Ahead?
To summarize the grand architecture of Enterprise Statistics:
- IIP is your quick monthly thermometer to check if factory engines are running.
- ASI is your comprehensive annual scan of the organized manufacturing giants.
- ASUSE tracks the millions of small, unorganized local businesses.
- ASSSE monitors the booming service sector.
Together, these datasets allow policymakers to fine-tune industrial policies, track employment, and compute the National GDP through the National Accounts Division with absolute precision!
We have now explored the deep concepts of GDP, Inflation, and Industrial Output. But all of these metrics rely heavily on one fundamental mathematical concept: Index Numbers. How do we actually calculate these indices? What formulas do we use to ensure accuracy?
In our next and final stop of this module, we will dive into Part 8: Index Number – The Mathematics, where we will mathematically decode the formulas behind the statistics. After that, Module 2 will officially end!
Keep revising the survey parameters, understand the vital role of EnSD, and we will see you in Part 8!
This article is part of our complete guide to Official Statistics for UPSC ISS. Bookmark the main guide for the full roadmap.
[…] 2: Economic Statistics, where we decoded the complex mathematics of GDP, Inflation (CPI/WPI), Industrial Output (IIP/ASI), and the formulas of Index […]
[…] We have arrived at a very special milestone. Today, we are officially wrapping up Module 2: Economic Statistics (The Money Part). Over the past few sessions, we have successfully decoded the nation’s wealth through GDP and National Accounts (Part 5), tracked the cost of living and inflation using CPI and WPI (Part 6), and measured the massive output of our factories and service sectors through ASI, IIP, ASUSE, and ASSSE (Part 7). […]