Welcome back, future Indian Statistical Service (ISS) officers!
You have successfully entered our final frontier – Module 5: New Trends & Global Standards.
Over the past four modules, we have tracked the nation’s wealth (GDP and Inflation), measured the output of our factories and farms, and counted our massive human and livestock populations. But in the 21st century, simply measuring “Economic Growth” is no longer enough.
What is the use of a booming GDP if our rivers are highly polluted, our forests are vanishing, and there is massive gender inequality? The world has realized that development must be sustainable. Furthermore, in an interconnected world, India’s data cannot exist in isolation; it must speak a global language and align with global targets.
Today, we are going to decode the United Nations 2030 Agenda. We will explore the massive shift from MDGs to SDGs, understand how the Social Statistics Division (SSD) of MoSPI tracks these goals through the National Indicator Framework (NIF), and dive into the fascinating, highly advanced field of Environmental Accounting (EnviStats).
For your UPSC ISS exams and interviews, this is a highly contemporary, high-yield topic. Let us decode the statistics of our planet’s future!
The Paradigm Shift: MDGs vs. SDGs
To understand the SDGs, we must first look at their predecessors: the Millennium Development Goals (MDGs). Adopted in the year 2000, the MDGs were a set of 8 goals and 18 targets aimed at reducing extreme poverty, child mortality, and diseases like HIV/AIDS by 2015. However, the MDGs had severe limitations:
- Limited Scope: They strictly focused on social and economic development, largely ignoring the environment and climate change.
- Developing Nations Only: The MDGs were essentially targets set for poor and developing countries. Developed nations were not obligated to change their own domestic policies.
Realizing that climate change and inequality affect everyone, the 70th Session of the United Nations General Assembly adopted a revolutionary, holistic approach on 25th September 2015: “Transforming our World: the 2030 Agenda for Sustainable Development.”
This new agenda gave birth to the Sustainable Development Goals (SDGs), which officially came into force on 1st January 2016.
- The Scale: Unlike the 8 MDGs, there are 17 SDGs and 169 specific targets.
- The 3 Dimensions: The SDGs beautifully integrate the three dimensions of development: Economic, Social, and Environmental.
- Universality: Unlike MDGs, the SDGs apply universally to all nations – rich and poor alike.
The 17 Goals: A Quick Categorization
As an ISS aspirant, you should ideally memorize the 17 goals, but understanding their broad categorization is even more critical for your analytical answers:
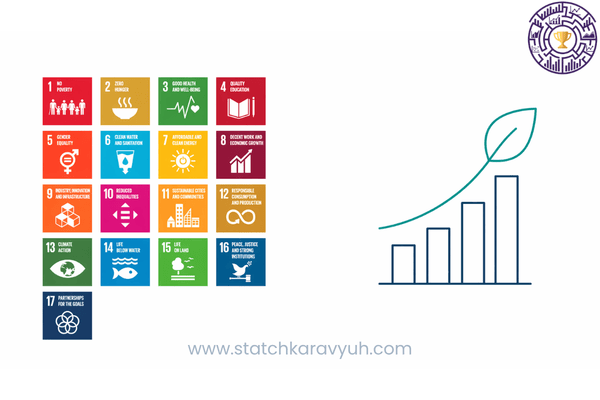
- Social Goals (1 to 6): No Poverty (1), Zero Hunger (2), Good Health (3), Quality Education (4), Gender Equality (5), Clean Water & Sanitation (6).
- Economic Goals (7 to 11): Affordable & Clean Energy (7), Decent Work & Economic Growth (8), Industry, Innovation & Infrastructure (9), Reduced Inequalities (10), Sustainable Cities (11).
- Environmental Goals (12 to 15): Responsible Consumption & Production (12), Climate Action (13), Life Below Water (14), Life on Land (15).
- Institutional Goals (16 to 17): Peace, Justice & Strong Institutions (16), Partnerships for the Goals (17).
The Indian Machinery: MoSPI’s SSD and NITI Aayog
India is a signatory to the UN resolution adopting the SDGs. However, how does a massive, decentralized country track 169 targets? The responsibility is divided between two massive government bodies.
1. NITI Aayog (The Overseer & Ranker) NITI Aayog has been entrusted with the overall responsibility of overseeing the implementation of SDGs in India. To foster competitive federalism, NITI Aayog publishes the SDG India Index, which ranks States and Union Territories based on their performance. States are classified into four categories based on their scores:
- Aspirant: 0–49
- Performer: 50–64
- Front Runner: 65–99
- Achiever: 100
2. MoSPI (The Data Architect) While NITI Aayog ranks the states, who provides the data and decides the mathematical indicators? That is the job of MoSPI, specifically the Social Statistics Division (SSD). SSD is responsible for developing the National Indicator Framework (NIF).
🌟 Interview Focus: GIF vs. NIF
If the interview panel asks you, “Why does India need a National Indicator Framework (NIF) when the UN already gave us a Global Indicator Framework (GIF)?”
Your Answer: The UN’s GIF contains over 230 indicators designed for global comparability. However, many global indicators are simply not relevant or measurable in the Indian context (e.g., indicators dealing with snow-capped regions or specific global treaties). Therefore, MoSPI customized the global framework to suit India’s unique domestic priorities, creating the National Indicator Framework (NIF), which consists of around 286-290 specifically tailored indicators. For example, to track “Clean Energy” (Goal 7), India heavily utilizes its own administrative data regarding the Ujjwala Yojana (LPG connections).
(Current Affairs Link: Remember Part 15? MoSPI specifically launched the Multiple Indicator Survey (MIS)during the NSS 78th Round to fill the massive data gaps required to calculate these specific SDG indicators!)
The New Frontier: Environmental Accounting (EnviStats)
For decades, economists measured the wealth of a nation solely by its GDP. If you cut down a 100-year-old forest and sell the timber, your GDP goes up, making the country look “richer.” But in reality, you just permanently destroyed a priceless natural asset. Traditional GDP does not account for the depletion of natural resources.
To fix this massive flaw, MoSPI’s Social Statistics Division has pioneered one of the most advanced statistical exercises in the world: Environmental Economic Accounting.
India follows the UN System of Environmental-Economic Accounting (SEEA) framework. Every year, MoSPI releases its flagship publication in two volumes:
1. EnviStats India Vol. I (Environment Statistics)
- Release Date: Last working day of March.
- Content: This covers the physical statistics of the environment. It tracks ambient air quality, absolute emissions of CO2, monsoon performance, groundwater levels, and biodiversity.
2. EnviStats India Vol. II (Environmental Accounts)
- Release Date: Last working day of September.
- Content: This is where the hardcore “accounting” happens. It provides asset accounts for various natural resources.
- Key Accounts Include:
- Land Use-Land Cover (LULC) Accounts: Tracking how agricultural land is converting to urban settlements.
- Water Quality Accounts: Measuring the health of our rivers and lakes.
- Forest and Soil Accounts: Valuing the carbon retention services provided by forests and the soil erosion prevention services provided by agricultural lands.
By developing these Environmental Accounts, MoSPI is laying the mathematical foundation for a future where India might officially calculate a “Green GDP”!
Conclusion & What Lies Ahead?
To summarize:
- SDGs replaced MDGs to provide a holistic, universal approach to Economic, Social, and Environmental development.
- MoSPI’s SSD builds the National Indicator Framework (NIF) to track these goals, while NITI Aayog uses this data to rank the states.
- Through EnviStats, India is finally putting a statistical value on its forests, water, and soil, moving beyond the traditional limitations of GDP.
We are almost at the finish line!
Over the past 15 blogs, you have mastered everything from Acts and Policies to GDP, Inflation, Agriculture, Population, and Global Goals. But how does a statistician actually behave? What are the ethics of this profession? And what is the ultimate future of official statistics in the age of Artificial Intelligence and Big Data?
In our Grand Finale, Part 17: The Future & The Ethics (UNFPOS & Modernization), we will decode the 10 UN Fundamental Principles of Official Statistics, explore MoSPI’s futuristic Data Innovation Lab (DI-Lab), and wrap up this entire comprehensive series!
Keep revising the 17 SDGs, understand the difference between NIF and GIF, and we will see you in the grand finale, Part 17!
This article is part of our complete guide to Official Statistics for UPSC ISS. Bookmark the main guide for the full roadmap.
[…] Take a moment to look back at the phenomenal journey you have completed. We started by building the grand administrative machinery of MoSPI (Module 1), counted the nation’s wealth and industrial output (Module 2), walked through the agricultural fields (Module 3), tracked the human population and employment rates (Module 4), and recently aligned our goals with the United Nations SDGs (Part 16). […]