Welcome back, future Indian Statistical Service (ISS) officers!
Congratulations on successfully arriving at our final and most modern phase – Module 5: New Trends & Global Standards.
Over the past four modules, we have meticulously built your foundational knowledge. You know how the Ministry of Statistics and Programme Implementation (MoSPI) operates (Module 1), how GDP and Inflation are calculated (Module 2), how we estimate crops and livestock (Module 3), and how we track human population, vital rates, and employment through the mighty PLFS (Module 4).
But throughout all these modules, we kept referring to one magical acronym: The NSS Rounds.
Whether we needed weights for calculating the Consumer Price Index (CPI), poverty estimates for the NITI Aayog, or out-of-pocket health expenditures for policymakers, we relied on the National Sample Survey (NSS).
Today, we are going to place these “Rounds” under the microscope. What exactly is a Round? What mathematical sampling design does the field army use to select a specific house in a remote Indian village? And what were the themes of the recent 77th, 78th, and 79th rounds?
For your UPSC ISS Statistics Paper II and the interview, this blog is a pure goldmine of technical methodologies and current affairs. Let us decode the heart of India’s socio-economic data!
What is an “NSS Round”?
Before Independence, collecting socio-economic data meant counting everyone (a Census) or relying entirely on flawed administrative registers. It was Prof. P.C. Mahalanobis who proved that a scientifically designed representative sample could provide highly accurate national estimates at a fraction of the cost and time.
This led to the birth of the National Sample Survey (NSS) in 1950. The NSS is a continuous, multi-purpose socio-economic inquiry of all-India coverage. It is carried out in the form of successive “Rounds”.
- Duration: Typically, the duration of one Round is one year. Historically, it followed the Agricultural Year (July to June), but recently, many rounds have shifted to the Calendar Year (January to December).
- The Subjects: The NSS does not ask the same questions every year. The subjects change based on the urgent data needs of the government. One round might focus entirely on health and education, while the next round might focus exclusively on farmers’ debt and land holdings.
The Mathematics: Sampling Design of NSS
If the UPSC ISS Interview Panel asks you: “How does MoSPI ensure that a sample of just 1.5 Lakh households accurately represents 1.4 Billion Indians?”, you must confidently explain their standard sampling architecture.
In NSS Surveys, a highly robust, standard sampling design is used: A Stratified Multi-Stage Random Sampling design. Let us break down this technical jargon:
1. Stratification (Dividing the Country): The entire country is divided into strata. In most cases, the District acts as the basic stratum. This ensures that every single district in India gets represented in the final data.
2. First Stage Units (FSUs): You cannot just randomly pick a house in India; you need a geographic boundary first.
- In Rural Areas: The FSUs are the Villages (as per the latest Population Census).
- In Urban Areas: The FSUs are the Urban Frame Survey (UFS) Blocks (maintained and continuously updated by MoSPI’s Field Operations Division).
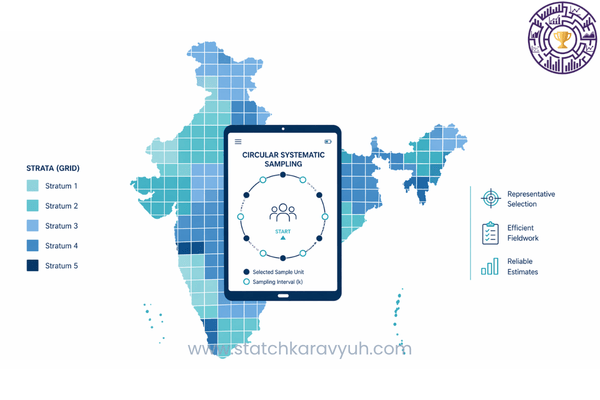
- Selection Method: These FSUs are generally selected using a Circular Systematic Method with Probability Proportional to Size (PPS). (This means larger villages have a mathematically higher chance of being selected than very tiny ones).
3. Ultimate Stage Units (USUs): Once the field investigator reaches the selected Village or UFS block, they conduct a complete houselisting operation (mapping every single house). From this list, a specific number of households (usually 10 to 22, depending on the survey) are randomly selected. These households are our Ultimate Stage Units (USUs) from which the actual data is collected!
The Golden Concept: Reference Periods (URP, MRP, MMRP)
When an investigator asks a household, “How much did you spend on clothing?”, the answer depends entirely on the time frame. Did they mean yesterday, last month, or last year?
If the time frame is too long (say, 5 years), the informant will suffer from “recall lapse” (they will simply forget). If it is too short (say, 1 day), the survey might completely miss rare purchases like buying a refrigerator or paying school fees.
To solve this, NSS Consumer Expenditure Surveys (CES) use highly sophisticated moving reference periods. You must memorize these three terms:
1. Uniform Reference Period (URP): This is the oldest method. Here, data on consumption expenditure is collected for all items (food, clothing, durables) using a uniform recall period of the last 30 days.
2. Mixed Reference Period (MRP): Economists realized people do not buy clothes or TVs every 30 days. So, MRP uses two different periods:
- Last 365 Days: For 5 specific low-frequency items (Clothing, Bedding, Footwear, Institutional Medical care, and Durable goods).
- Last 30 Days: For all other items (like food and fuel).
3. Modified Mixed Reference Period (MMRP): This is the most scientifically advanced method currently used by MoSPI and recommended globally. It uses three different time frames to fight memory lapse perfectly:
- Last 7 Days: For highly perishable, daily-use items (Edible oil, eggs, fish, meat, vegetables, fruits, spices, and pan/tobacco). Because you cannot remember how many tomatoes you bought 25 days ago!
- Last 365 Days: For low-frequency items (Clothing, footwear, durables, education, and institutional medical care).
- Last 30 Days: For the remaining items (Fuel, rent, and non-institutional medical care). (Connectivity Note: The weights for India’s current Consumer Price Index (CPI) are derived strictly from the MMRP data of the NSS!)
A Tour of Recent NSS Rounds (Current Affairs)
As an ISS aspirant, you are expected to know the themes of the latest surveys. Here is your ultimate cheat sheet for the recent rounds:
1. NSS 75th Round (July 2017 – June 2018)
- Themes: Household Social Consumption on Education & Health, and the Consumer Expenditure Survey.
- Significance: It captured the out-of-pocket medical expenditure of Indians and the gross enrolment ratios in education. (Note: The Consumer Expenditure Survey results for this round were officially withheld due to data quality concerns, sparking massive economic debates).
2. NSS 76th Round (July 2018 – Dec 2018)
- Themes: Drinking Water, Sanitation, Hygiene (WASH), and Housing Conditions. It also included a crucial survey on Persons with Disabilities.
3. NSS 77th Round (Jan 2019 – Dec 2019) – Highly Important!
This was a blockbuster round covering the agrarian and financial pulse of India.
- All India Debt & Investment Survey (AIDIS): Measured the average value of physical/financial assets owned by households, the incidence of indebtedness, and average cash dues.
- Land & Livestock Holdings: Measured the exact size of operational holdings and livestock ownership.
- Time Use Survey (TUS): This was conducted for the very first time! TUS captures how Indians (aged 6 and above) spend their 24 hours. It is revolutionary because it officially measures the massive unpaid domestic and caregiving services predominantly performed by women, which are usually invisible in normal GDP calculations.
4. NSS 78th Round (Jan 2020 – Dec 2020)
- Themes: Domestic Tourism Expenditure and the Multiple Indicator Survey (MIS).
- Significance: The MIS was specifically designed to collect data for various global Sustainable Development Goals (SDGs) indicators that were not being captured by any other existing ministry data!
5. NSS 79th Round & 80th Round (The Modern Era)
- 79th Round: Featured the Comprehensive Annual Modular Survey (CAMS) to generate high-demand socio-economic indicators, and notably, the first-ever Survey on AYUSH to gauge the penetration and awareness of traditional Indian medicine systems.
- 80th Round: A highly dynamic ongoing round featuring modular surveys on Telecom, Education expenditures, and the National Household Travel Survey (conducted in collaboration with the Ministry of Railways and Ministry of Tourism).
The Digital Transformation (e-SIGMA)
Gone are the days when NSS enumerators carried massive bundles of 50-page paper schedules to rural villages.
MoSPI has undergone a massive digital revolution. The primary aim is to convert the entire data collection endeavor into a Computer Assisted Personal Interview (CAPI) mode. To achieve this, the Data Quality Assurance Division (DQAD) developed e-SIGMA (e-Survey Instrument and Generalised Multimodal Application). e-SIGMA comes with in-built, real-time data validation. If an enumerator types that a 5-year-old child holds a Ph.D., the tablet will immediately flag an error on the spot, drastically reducing non-sampling errors and the time taken for data processing!
Conclusion & What Lies Ahead?
To summarize, the National Sample Survey Office (now integrated within the NSO) is the sensory nervous system of the Indian government. Through its highly scientific Stratified Multi-Stage Sampling Design, its brilliant use of MMRP reference periods, and its dynamic selection of subjects across different Rounds, it provides the raw data that runs our democracy.
In our discussion of the 78th Round, we mentioned that the Multiple Indicator Survey (MIS) was conducted specifically to track SDGs. But what exactly are these SDGs? Why is India suddenly so obsessed with them, and how are we tracking them?
In our next blog, Part 16: Global Goals – SDGs & Environmental Accounting, we will decode the United Nations 2030 Agenda! We will explore the 17 Sustainable Development Goals, the National Indicator Framework (NIF) developed by MoSPI, and the fascinating new world of measuring our forests and water through ‘EnviStats’!
Keep revising your URP and MMRP definitions, remember the details of the Time Use Survey from the 77th round, and we will see you in Part 16!
This article is part of our complete guide to Official Statistics for UPSC ISS. Bookmark the main guide for the full roadmap.
[…] Affairs Link: Remember Part 15? MoSPI specifically launched the Multiple Indicator Survey (MIS)during the NSS 78th Round to fill […]