If there is one thing that separates a good JAM preparation from a great one, it is systematic PYQ (Previous Year Question) analysis. Previous year papers are not just practice material — they are a window into the examiner’s mind. They tell you what topics are favored, how questions are structured, and what level of depth is expected.
In this article, we will do a comprehensive analysis of IIT JAM Mathematical Statistics PYQs from the last decade – covering topic-wise distribution, difficulty trends, recurring question patterns, and actionable takeaways for your preparation.
Why PYQ Analysis Matters
Many students solve PYQs as a “last step” in preparation. This is a mistake. PYQ analysis should inform your preparation from the very beginning. Here is why:
It tells you which topics are asked every year – so you can prioritize them. It shows you the exact difficulty level – so you know how deep to go in each topic. It reveals recurring question formats – so you can practice similar problems. It helps you calibrate your mock test performance against the actual exam standard.
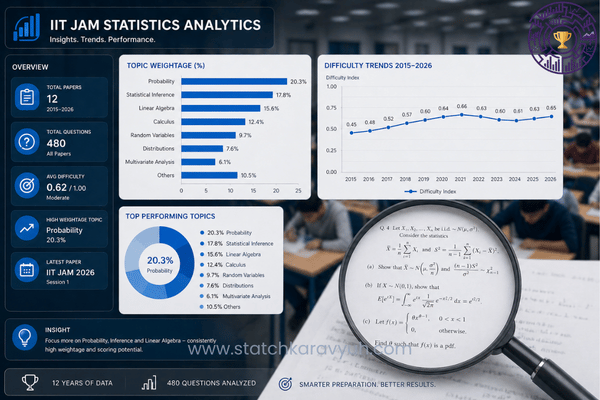
Topic-Wise Distribution – What Gets Asked Most?
Based on analysis of JAM MS papers from 2015 to 2025, here is the approximate topic-wise weightage:
Statistics Section (60% of total marks):
Probability and Random Variables: 12–16 marks (appears every year, multiple questions). This includes conditional probability, Bayes’ theorem, expectation, variance, MGFs, and functions of random variables.
Standard Distributions: 10–14 marks (appears every year). Questions on Binomial, Poisson, Normal, Exponential, Gamma, and Uniform distributions. Often asks for MGFs, mean, variance, or probability calculations using these distributions.
Joint and Conditional Distributions: 6–10 marks (appears most years). Marginal distributions, conditional distributions, independence, covariance, and correlation.
Estimation: 8–12 marks (appears every year). MLE, method of moments, properties of estimators (unbiasedness, consistency, sufficiency), Cramer-Rao bound, and UMVUE.
Testing of Hypotheses: 6–10 marks (appears every year). NP lemma, UMP tests, likelihood ratio tests, and confidence intervals.
Sampling Distributions: 4–6 marks (appears most years). Chi-square, t, and F distributions, and their applications in inference problems.
Mathematics Section (40% of total marks):
Real Analysis (Sequences, Series, Limits, Continuity): 8–12 marks. Convergence of sequences and series is tested almost every year. Properties of continuous and differentiable functions appear regularly.
Linear Algebra: 8–12 marks. Eigenvalues, eigenvectors, rank, nullity, vector spaces, and linear transformations are consistently tested. This is the highest-scoring math topic.
Calculus (Single and Multivariable): 6–10 marks. Derivatives, integrals, Taylor series, functions of several variables, maxima-minima. Beta and Gamma integrals appear in many papers.
Difficulty Trends Over the Years
The difficulty level of JAM MS has fluctuated over the years, but a clear trend has emerged:
2015–2018: Papers were moderately difficult. The statistics section was straightforward for well-prepared students. The mathematics section had tricky questions, especially in real analysis.
2019–2022: Difficulty increased noticeably. Questions became more application-oriented, with fewer direct formula-based problems. The MSQ section became trickier, with questions requiring careful analysis of all options.
2023–2025: Papers settled into a consistent moderate-to-tough range. Questions increasingly test conceptual understanding rather than computational speed. NAT questions often involve multi-step calculations.
The takeaway: JAM MS is not getting easier. Superficial preparation will not be enough. You need genuine understanding of concepts, not just formula memorization.
Recurring Question Patterns
Here are specific question patterns that repeat across multiple years:
Pattern 1: “Find the MLE of a parameter given a random sample.” This appears almost every year. The distributions used vary (Uniform, Exponential, Normal, Geometric), but the technique is always the same – write the likelihood, take the log, differentiate, and solve.
Pattern 2: “Determine whether an estimator is UMVUE.” Questions ask you to check sufficiency (factorization theorem), completeness, and then apply Rao-Blackwell or Lehmann-Scheffe. This requires understanding the complete pipeline of optimal estimation.
Pattern 3: “Find the MGF of X and hence determine the distribution.” Common for standard distributions. They give you a distribution and ask for the MGF, or give the MGF and ask you to identify the distribution.
Pattern 4: “Find eigenvalues and determine if a matrix is diagonalizable.” Linear algebra questions almost always involve eigenvalues. Sometimes they ask for the trace or determinant using eigenvalue properties.
Pattern 5: “Test convergence of a given series.” Real analysis questions frequently give a series and ask whether it converges or diverges, requiring application of ratio test, root test, or comparison test.
Pattern 6: “Find the conditional distribution of Y given X=x.” Joint distribution problems where you need to find marginals, conditionals, or check independence.
Pattern 7: “Apply Neyman-Pearson Lemma to find the most powerful test.” Hypothesis testing questions often ask for the critical region of the MP or UMP test for a given scenario.
Section-Wise Strategy Based on PYQ Analysis
Section A (MCQs — 30 questions, negative marking): Based on PYQ analysis, approximately 10–12 MCQs in this section are straightforward for well-prepared students. Another 10–12 are moderate, and 6–8 are tricky.
Strategy: Attempt all easy ones first. For moderate ones, use elimination where possible. Skip genuinely tricky ones and come back later.
Section B (MSQs — 10 questions, no partial marking): MSQs are the toughest section because you need to correctly identify all correct options to get marks. Based on PYQ analysis, 3–4 MSQs per paper are approachable, while the rest require careful analysis.
Strategy: Only attempt MSQs where you are confident about all options. A half-right MSQ gives zero marks.
Section C (NATs — 20 questions, no negative marking): NATs are the best section for scoring because there is no penalty for wrong answers. Based on PYQ analysis, 12–15 NATs are computational and can be solved with careful calculation.
Strategy: Attempt every NAT question. Even a rough approximation might give you the right numerical answer.
How to Use PYQs in Your Preparation
Here is a structured approach to using PYQs effectively:
Step 1: Topic-wise PYQ solving (during study phase). As you complete each topic, immediately solve all PYQs from that topic across all available years. This reinforces learning and shows you the exam-level difficulty.
Step 2: Full-length PYQ papers (during mock test phase). Once you have completed the syllabus, solve complete PYQ papers under timed conditions. Grade yourself and analyze mistakes.
Step 3: Error log. Maintain a log of every PYQ you got wrong. Categorize errors as: conceptual error, calculation mistake, time management issue, or silly mistake. Review this log weekly.
PYQs Plus Mock Tests – The Winning Combination
PYQs give you the real exam standard, but they have a limitation: you have already seen them. You know what is coming. In the actual exam, every question is new. That is why you need fresh mock tests alongside PYQs.
StatChakravyuh’s test series for IIT JAM Statistics bridges this gap. The tests are designed based on PYQ analysis – they follow the same topic distribution, difficulty level, and question patterns as the real exam, but with completely original questions. This means you get the benefit of PYQ-calibrated practice without the false confidence of solving questions you have already seen.
Key Takeaways from PYQ Analysis
Probability and distributions are the highest-priority topics – they appear in every paper with significant marks. Estimation (MLE, UMVUE, Cramer-Rao) is tested every year without exception. Linear algebra is the highest-scoring math topic – master eigenvalues and vector spaces. NAT section is your best friend – attempt every question since there is no negative marking. MSQ section is the most dangerous – only attempt when fully confident. The exam is getting more conceptual – formula memorization alone will not work.
Conclusion
PYQ analysis is not a one-time activity. It should be an ongoing part of your preparation – informing your study priorities, guiding your practice, and calibrating your readiness. The students who score highest in JAM MS are the ones who know the exam intimately through PYQ analysis and supplement it with regular mock tests.
Study the exam. Then beat it.
StatChakravyuh offers PYQ-calibrated test series for IIT JAM Statistics and GATE Statistics. Practice. Improve. Repeat.