
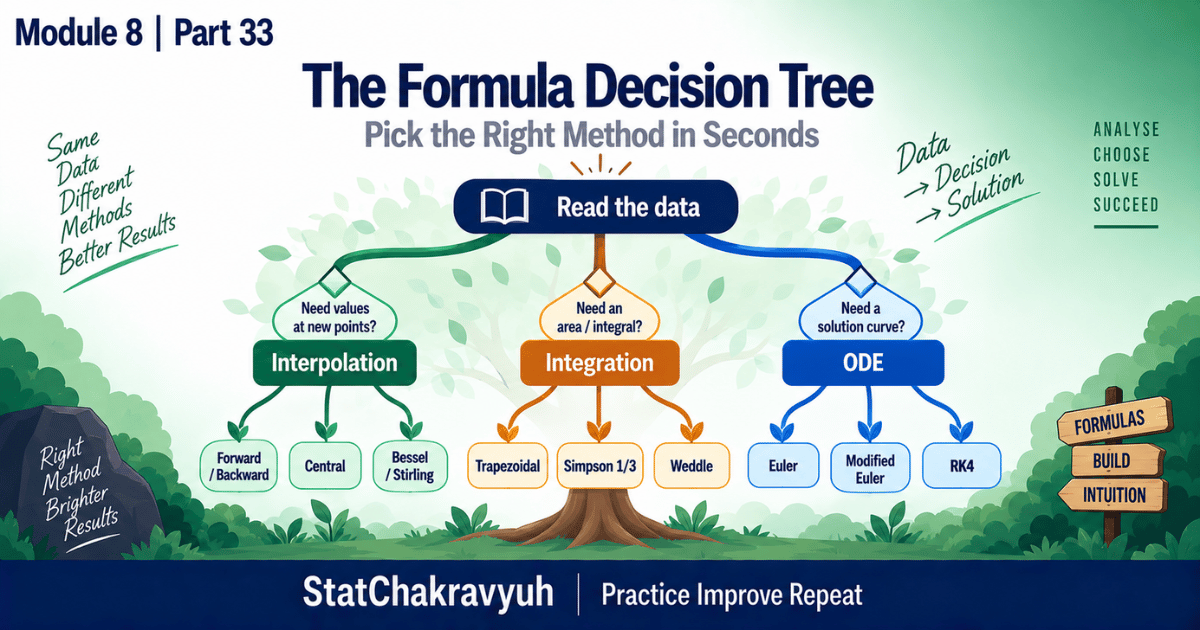
Welcome back to Part 33 of Module 8, updated for the UPSC ISS 2026 to 2027 cycle. The formula sheet armed you, the master tables sharpened you, but a weapon is useless if you do not know when to draw it. With roughly 90 seconds per question and no calculator, choosing the wrong formula means five minutes of ugly fractions ending in a wrong answer. Today we hardwire the Decision Tree: three flowcharts that pick the correct method the moment you glance at the data.
This post is Part 33 of the Last Minute Revision Guide (Module 8), inside our UPSC ISS Numerical Analysis Complete Guide. Roadmap at the UPSC ISS hub.
The Story of Amit and the Center Point Trap
Amit, a hardworking aspirant, faces a mock question: population data from 1981 to 2021, interpolate the year 2005. He reflexively fires the Newton Gregory Forward formula, builds a giant difference table, and grinds decimals for eight minutes. Because 2005 sits near the middle of the table, his is large, the higher order terms amplify instead of vanishing, and his answer matches none of the four options.
The Decision Tree would have saved him instantly: a target near the middle demands a central formula like Stirling’s or Bessel’s, where u stays close to zero, the higher differences collapse, and the answer emerges in 60 seconds.
Decision Tree 1: Interpolation (The “Where Is It?” Flowchart)
First question: are the intervals equal or unequal?
Branch A, unequal intervals (scattered data). If the question demands the direct algebraic polynomial, use Lagrange’s formula. If it demands inverse interpolation, finding for a given , use Lagrange with x and y swapped. For standard scattered data evaluation, use Newton’s Divided Difference formula.
Branch B, equal intervals. Now ask where the target lies. Near the beginning: Newton Gregory Forward. Near the end: Newton Gregory Backward. Near the middle: a central formula, with one sub decision. If the target sits very close to a tabulated central value, within , use Stirling’s formula. If it sits near the halfway mark between two central values, within , use Bessel’s formula.
Decision Tree 2: Numerical Integration (The “Interval Count” Flowchart)
Do not apply Simpson’s rule out of habit. Count the sub intervals first, remembering equals the number of data points minus one.
If is any number, use the Trapezoidal Rule, exact for degree 1. If is a multiple of 2, use Simpson’s 1/3 Rule, requiring an odd number of points and exact up to degree 3. If is a multiple of 3, use Simpson’s 3/8 Rule, also exact up to degree 3. If is a multiple of 6, use Weddle’s Rule, needing at least 7 points and exact up to degree 5.
The ultimate bypass check, before any rule. Read the integrand. If its highest power sits at or below the rule’s exactness degree, drop the formula and integrate with plain calculus. This single check converts the longest questions on the paper into the shortest.
Decision Tree 3: Ordinary Differential Equations (The “Accuracy” Flowchart)
For initial value problems, the choice follows the required output and precision. Need the continuous equation of the curve rather than a number? Use Picard’s Method. Need a quick rough step? Use Euler’s Method, RK1, minding its local error. Need a predictor corrector loop for stability? Use the Modified Euler’s Method, RK2. Need maximum precision without derivatives? Use the Runge Kutta Fourth Order Method, minding the local error trap.
Solved PYQ Masterclass
PYQ (UPSC ISS 2021 cycle, as recorded in our PYQ archive): Consider the following statements. One: in interpolation, to find a tabulated value near the beginning of the table, Newton’s forward formula is used. Two: to find an interpolated value near the centre of the table, Bessel’s formula is used. Three: for unequal subintervals, Lagrange’s interpolation formula is used. Which of the statements are correct?
(a) 1 and 2 only (b) 2 and 3 only (c) 1 and 3 only (d) 1, 2 and 3
The 5 second logic. Run each statement through the tree. Beginning of the table maps to Newton Forward: true. Near the centre maps to central formulas, Bessel included: true. Unequal subintervals map to Lagrange or Newton’s Divided Difference: true.
Final Answer: (d) 1, 2 and 3. Two marks banked by walking a mental flowchart.
Common Traps to Avoid
Trap 1: Amit’s mistake, forcing the Forward formula onto a central target and letting a large amplify the higher differences.
Trap 2: Confusing the Stirling and Bessel windows. Close to a tabulated value means Stirling; close to the halfway point means Bessel.
Trap 3: Skipping the bypass check and grinding a formula that the exactness property has already made unnecessary.
Frequently Asked Questions
What actually goes wrong if I use Newton Forward for a middle point?
The origin sits far from the target, so becomes large. Large amplifies the higher order difference terms instead of shrinking them, producing massive truncation errors.
How do I choose between Stirling and Bessel, since both serve the centre?
By the value of . Very close to a tabulated central value, , choose Stirling. Nearly halfway between two central values, , choose Bessel.
Can Weddle’s Rule run on 6 data points?
No. It needs intervals in multiples of 6, and 6 intervals require a minimum of 7 consecutive data points, through .
For unequal intervals, when Lagrange and Newton’s Divided Difference both apply, which wins?
Both produce the identical polynomial. Newton’s is cleaner for evaluating a value or building a reusable table; Lagrange is superior when the direct algebraic equation is demanded or when inverse interpolation requires swapping and .
Take the Next Step with StatChakravyuh
Join the Free UPSC ISS WhatsApp Community. The Module 8 PDF, with the full Top 100 PYQ mix to drill these decisions, releases in the community. 👉 Join the WhatsApp Community now
Enroll in the Free UPSC ISS Course. Structured lessons and practice sets on the Practice Improve Repeat system, at zero cost. 👉 Enroll in the Free Course
Coming up in Part 34, the grand finale of the entire series: the Top 25 Most Repeated PYQs in a rapid fire drill of one line shortcuts.