The only resource you need to master Official Statistics for UPSC ISS. Twenty in-depth lessons across six modules, structured into one continuous learning path.
Why This Page Exists
If you are preparing for the Indian Statistical Service Examination, you have most likely faced one common frustration. The syllabus for Official Statistics for UPSC ISS is finite, but the source material is scattered everywhere. Government websites, MoSPI press releases, National Statistical Commission annual reports, NSSO methodology notes, and Census documents lie across hundreds of pages. No single resource brings them together in a structured, exam-ready form.
Consider a familiar scenario. You sit down to revise the National Statistical Office. You open the MoSPI website. Within minutes you are reading about the merger of CSO and NSSO, then jumping to the Rangarajan Commission, then to the Collection of Statistics Act. By the time you stop, three hours have passed and your notes look like a maze.
This page solves that problem.
It is a single, structured guide to Official Statistics for UPSC ISS, built around twenty articles arranged into six logical modules. Each module covers one pillar of India’s statistical system: the architecture, the economy, agriculture, society, modern global standards, and final revision. By the time you finish reading every linked article, you will have walked through every concept the exam tests, in the order that makes them easiest to remember.
Bookmark this page. You will return to it many times.
Official Statistics in the UPSC ISS Examination Pattern
Before you begin the content, it is important to understand exactly where Official Statistics sits within the larger exam.
In the UPSC Indian Statistical Service Examination, Official Statistics for UPSC ISS appears as one of the four sections within Objective Paper II. The section contains 20 multiple-choice questions, each worth 2.5 marks, for a total of 50 marks. Negative marking applies for incorrect answers, which means accuracy is as critical as preparation.
Several insights flow from this structure.
First, the syllabus is finite. Once you cover the topics in this guide thoroughly, there is very little new ground left to study.
Second, every single mark counts. Because the section is short and negative marking applies, candidates who attempt with confidence and clarity consistently outperform those who guess or rush through.
Third, the questions tend to be factual and definitional. Names of agencies, frequency of surveys, base years of indices, methodology choices, and recent reforms appear repeatedly across years. This is exactly the kind of content that rewards organised, well-structured preparation.
This is precisely why a pillar guide like this one works better than scattered reading. You do not need encyclopedic depth. You need accurate recall of the right facts, organised in a way the brain can retrieve under exam pressure.
How to Use This Guide
Read this page in three phases for the best results.
Phase one: the overview. Skim through all six modules below to get a bird’s-eye view of the entire syllabus. Do not try to absorb every detail. Just understand the structure and the logical flow from one module to the next.
Phase two: the deep dive. Pick one module per week. Click into each linked article and study it carefully. Take notes in your own words. By the end of six weeks, you will have covered the entire syllabus once.
Phase three: revision. Use Module 6 for last-mile revision. Formulas, agency lists, and key acts are consolidated there for fast recall.
The journey of this guide follows a clear sequence: Architecture, then Money, then Land, then People, then Modern World, then Revision. Once you see Official Statistics this way, it stops looking like a syllabus and starts feeling like a connected story.
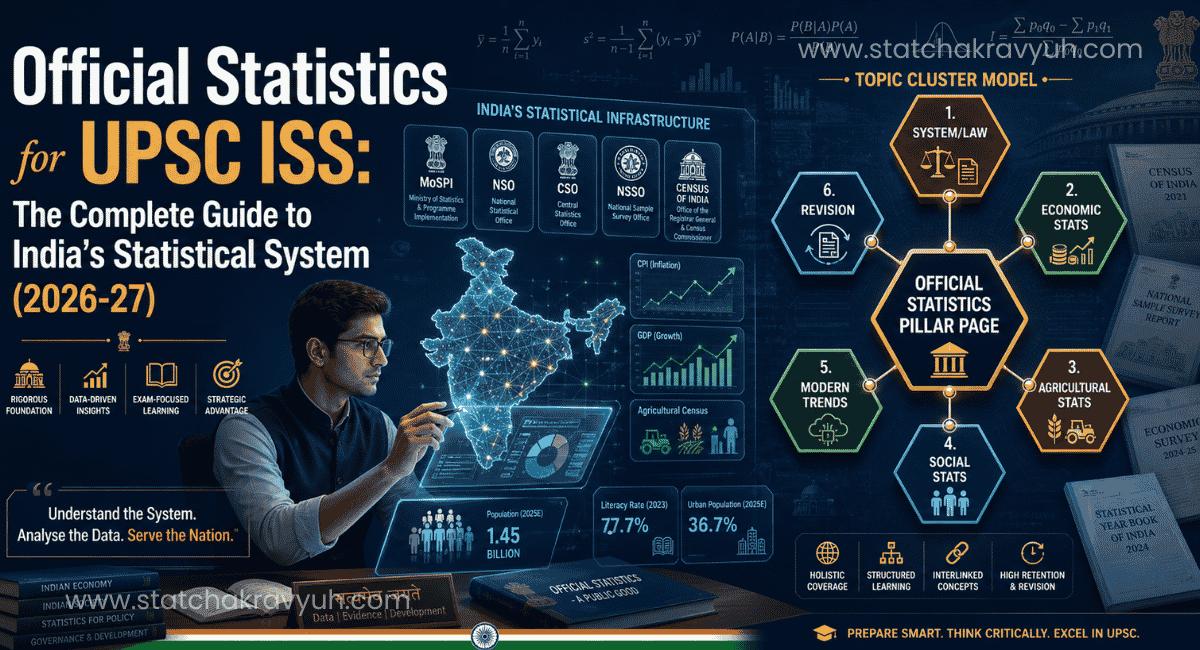
The Complete Roadmap: Six Modules at a Glance
| Module | Theme | # of Lessons |
|---|---|---|
| 1 | The Architecture (System and Law) | 4 lessons |
| 2 | Economic Statistics (The Money Part) | 4 lessons |
| 3 | Agricultural Statistics | 2 lessons |
| 4 | Social and Demographic Statistics | 4 lessons |
| 5 | New Trends and Global Standards | 4 lessons |
| 6 | The Ultimate Revision | 2 lessons |
Now let us walk through each module: what it teaches, why it matters in real life, and which articles to read.
Module 1: The Architecture: Who Runs India’s Numbers?
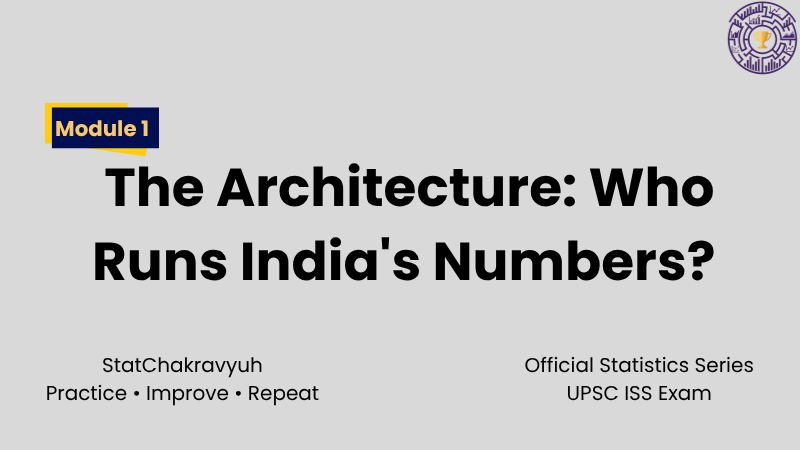
Every great system rests on three foundations: people, laws, and history. Before you study what the numbers say, you must understand who produces them and under what authority.
Consider this real situation. Within weeks of the COVID-19 lockdown announcement in March 2020, the Government of India needed to identify vulnerable populations for the Pradhan Mantri Garib Kalyan Yojana. The data used for that targeting came from existing census records and administrative databases, all maintained under the statistical architecture you will study in this module. Without that architecture, no welfare policy at scale would have been possible. The country’s response would have collapsed in confusion.
This module is your blueprint of that architecture.
Part 1: The Indian Statistical System: Who Runs the Numbers?

Begin with the master map. India’s statistical system is organised around the Ministry of Statistics and Programme Implementation (MoSPI), the National Statistical Office (NSO), the legacy structure of the Central Statistics Office (CSO), the National Sample Survey Office (NSSO), and dozens of subject-matter ministries that collect their own data. Each plays a specific role, and the moment you understand who does what, half of your confusion disappears.
This article walks you through the entire hierarchy, from the Cabinet down to the district statistical officer.
Read here: The Indian Statistical System
Part 2: The Watchdogs: National Statistical Commission (NSC)
If MoSPI is the factory, the National Statistical Commission is the quality controller. Set up after the recommendations of the Rangarajan Commission in 2005, the NSC’s job is to ensure India’s statistics remain credible, autonomous, and free from political interference.
You will learn about its composition, its mandate, its relationship with MoSPI, and the reforms it has pushed for over the years. This is a high-yield topic for the exam. Questions on the NSC appear in nearly every recent paper.
Read here: National Statistical Commission Explained

Part 3: The Rule Book: The Collection of Statistics Act, 2008
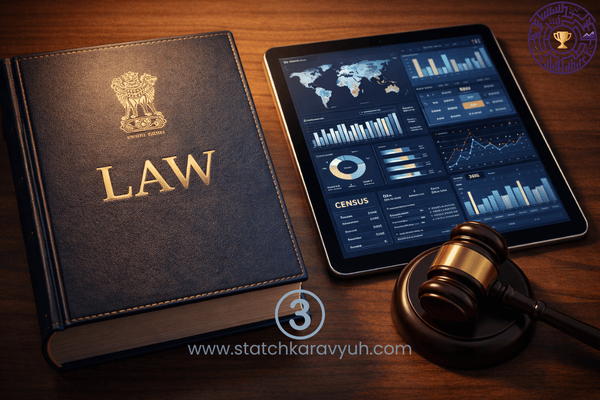
Data collection is not just about asking questions. It is about legal authority. Without the Collection of Statistics Act, 2008, no investigator could walk into a factory or a household and demand information.
This article breaks down the Act in simple language: penalties for non-cooperation, confidentiality clauses, the role of the statistics officer, and how the Act was amended to extend its reach to Jammu and Kashmir.
Read here: Collection of Statistics Act 2008
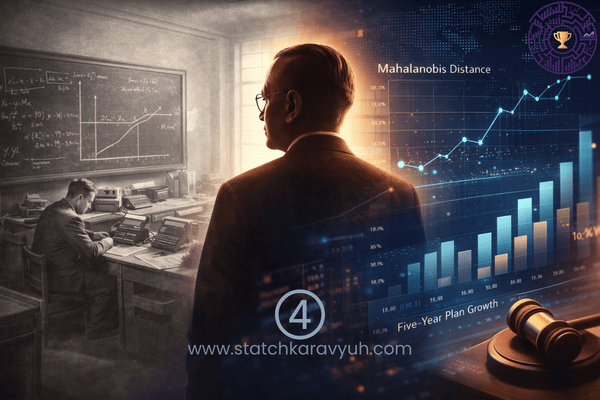
Part 4: The Legacy: ISI and the Mahalanobis Story
You cannot talk about Indian statistics without bowing to one name: Prasanta Chandra Mahalanobis. The founder of the Indian Statistical Institute (ISI), the architect of India’s planning model, the man behind the Mahalanobis Distance. His fingerprints are everywhere in our statistical system.
This article tells the story of the man, the institute he built, and the philosophical foundation he laid for everything that followed. Read it not just for marks, but for inspiration.
Read here: Prof. P.C. Mahalanobis and the ISI Legacy
What you will master in Module 1: The full structure of India’s statistical system, the role of the National Statistical Commission, the legal foundation of data collection in India, and the historical roots of Indian statistics.
Module 2: Economic Statistics: The Money Part
Now we move from people and laws to the economy itself. How do we know whether India is growing? How do we measure inflation? How do we track factories and services?
Every time the Reserve Bank of India announces its monetary policy, the headlines focus on one number: the inflation rate. That single number, which decides the interest on your home loan and the return on your savings, comes from the Consumer Price Index calculated by the National Statistical Office. Similarly, every Union Budget speech is built on GDP and GVA estimates released by NSO. The methodology behind those headline numbers is exactly what this module unpacks.
If Module 1 was the skeleton, Module 2 is the bloodstream of the country’s data system.
Part 5: National Accounts 101: Understanding GDP, GVA, and Methodologies
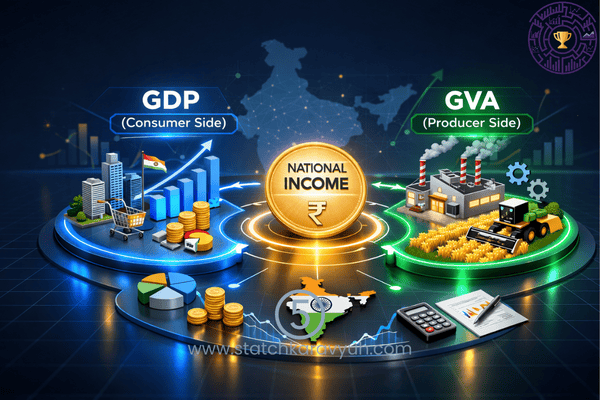
Most aspirants confuse GDP with GVA. The exam loves to exploit that confusion.
This article cleanly separates the two. It explains the production approach, the income approach, and the expenditure approach to calculating national income. It walks through the base year revisions and shows you exactly how nominal GDP differs from real GDP. By the end, you will never mix them up again.
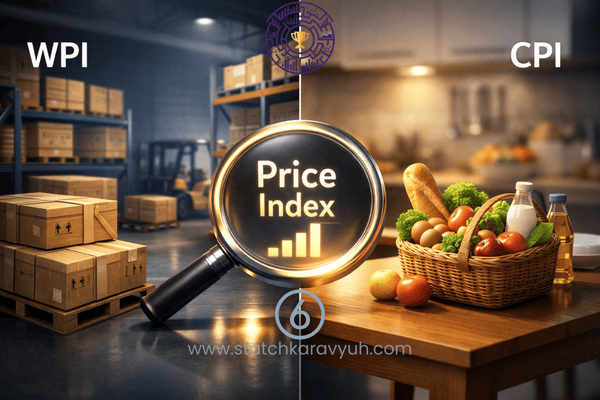
Part 6: Measuring Inflation: CPI vs WPI Explained
Inflation is the silent tax. But how do we measure it?
India uses two main indices. The Consumer Price Index (CPI) captures retail-level price changes faced by households. The Wholesale Price Index (WPI) tracks producer-level prices. The article explains the basket composition, the weights, the difference between CPI Combined, CPI Rural, and CPI Urban, and why the Reserve Bank of India now anchors monetary policy to CPI rather than WPI.
Read here: Measuring Inflation: CPI vs WPI in India
Part 7: Industrial Statistics: ASI, IIP, ASUSE and ASSSE Explained
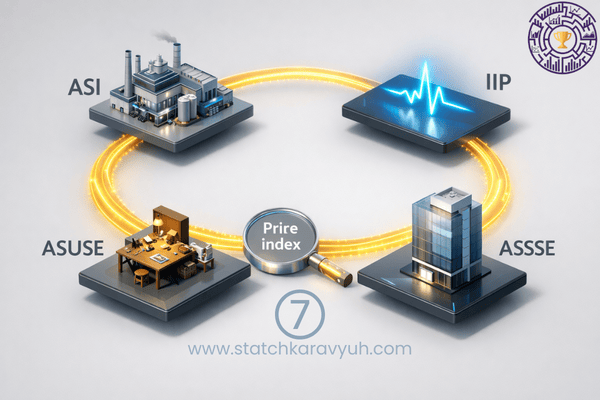
Industry is the engine. To measure that engine, India runs four key surveys and indices.
The Annual Survey of Industries (ASI) covers the formal manufacturing sector. The Index of Industrial Production (IIP) is the monthly pulse of industry. The Annual Survey of Unincorporated Sector Enterprises (ASUSE) tracks the informal economy. The Annual Survey of Services Sector Enterprises (ASSSE) captures services.
Each has a different purpose, sampling design, and reporting frequency. This article gives you the side-by-side comparison you will need on exam day.
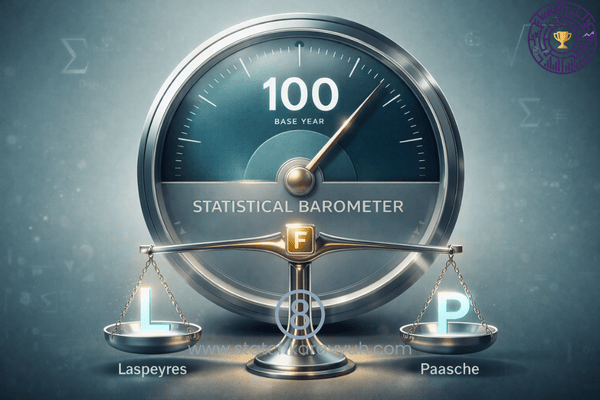
Part 8: Index Numbers: The Mathematics Behind the Data
Behind every CPI and IIP figure lies one tool: the index number. This article goes into the mathematics. Laspeyres index, Paasche index, Fisher’s ideal index, and the tests they must pass (time reversal, factor reversal, circular).
Do not skip this article even if you find the math intimidating. The exam frequently asks numerical problems based on these formulas, and they are among the easiest marks if you have practised.
Read here: Index Numbers in Official Statistics
What you will master in Module 2: The methodology behind GDP and GVA, the difference between CPI and WPI, the structure of all four major industrial surveys, and the index number theory that powers economic measurement.
Module 3: Agricultural Statistics: Counting Land and Harvest
India is, at its heart, an agrarian economy. Even today, nearly half of the workforce depends on agriculture. How does the government count crops, livestock, and farmland?
Consider how the government decides the Minimum Support Price for wheat each season. Before the announcement, agricultural production must be estimated. That estimation depends on the Timely Reporting Scheme, on land records collected through patwaris, and on crop cutting experiments designed decades ago by Indian statisticians. The tools you will study here directly determine farmer incomes across hundreds of millions of rural households.
This module is shorter than the others, but every topic here appears consistently in the UPSC ISS paper.
Part 9: Counting the Harvest: Crop Estimation (TRS, EARAS, ICS)
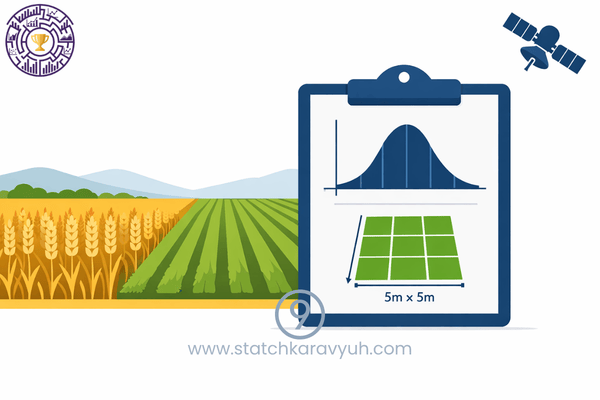
How does the government know how much wheat India produced last season? Through three layered systems.
The Timely Reporting Scheme (TRS) handles area estimation. The Establishment of an Agency for Reporting Agricultural Statistics (EARAS) covers states without land records. The Improvement of Crop Statistics (ICS) acts as a quality-check mechanism.
The article explains why each scheme exists, which states use which system, and how General Crop Estimation Surveys integrate with all three.
Read here: Crop Estimation in India: TRS, EARAS, ICS
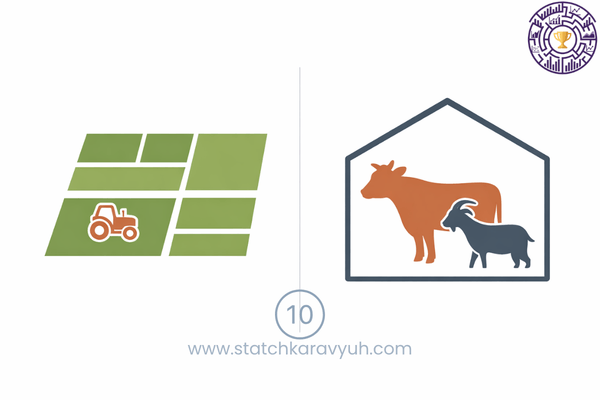
Part 10: The Census of Land and Animals
Every five years, India runs an Agriculture Census to map who owns how much land, and a Livestock Census to count cattle, buffalo, sheep, goats, poultry, and more. These two censuses feed nearly every agricultural policy in the country, from MSP to crop insurance to dairy schemes.
This article walks through their methodology, recent rounds, and the role of states in conducting them.
Read here: Agriculture and Livestock Census of India
What you will master in Module 3: How crop production and area are estimated, the role of state-level patwari records, and the structure of India’s agriculture and livestock censuses.
Module 4: Social and Demographic Statistics: The People Part
Numbers do not just describe the economy. They describe lives: births, deaths, schooling, health, jobs.
Consider this real example. The findings of the National Family Health Survey 5, released between 2019 and 2021, revealed that India’s Total Fertility Rate had fallen below the replacement level of 2.1 for the first time in the country’s history. This single data point shifted the entire national conversation on population policy. Behind that finding lay decades of methodological refinement, sampling design, and field investigation. All of it falls within the scope of this module.
This is where statistics becomes deeply human. And honestly, this is the most emotionally meaningful section of the entire syllabus, because what you are studying here is how India tracks the well-being of more than 1.4 billion people.
Part 11: The Grand Count: Population Census
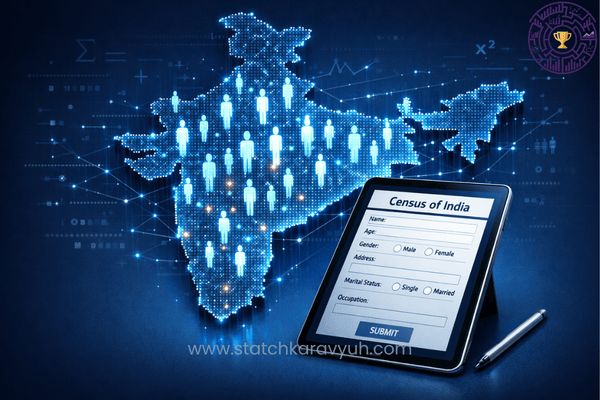
The Census of India is one of the largest administrative operations in the world. Conducted every ten years, it captures everything from population and household data to literacy, religion, occupation, and migration.
This article explains the census schedule, its two phases (House-listing and Population Enumeration), the legal framework under the Census Act, 1948, and why the Census matters for parliamentary delimitation, fund devolution, and welfare schemes.
Read here: Population Census of India
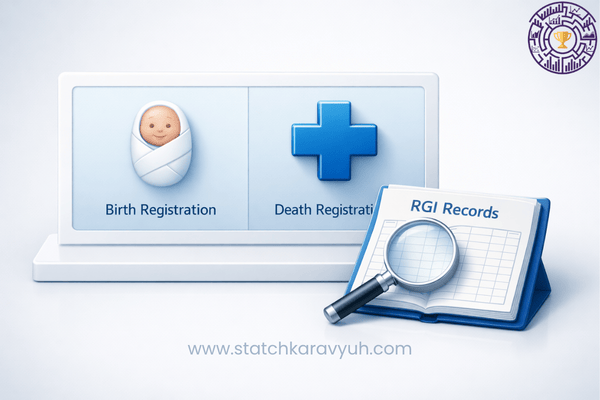
Part 12: Vital Statistics: SRS vs CRS
Births and deaths happen every minute. India tracks them through two systems.
The Civil Registration System (CRS) is the legal, universal registration of every birth and death. The Sample Registration System (SRS) is a sample-based system that gives reliable estimates of fertility, mortality, and infant mortality even where CRS coverage is incomplete.
The article compares them clearly and explains why both systems are needed, especially for indicators like Crude Birth Rate, Crude Death Rate, Infant Mortality Rate, and Total Fertility Rate.
Read here: Vital Statistics: SRS vs CRS
Part 13: Health and Education: NFHS and U-DISE Explained

Two of India’s most important social surveys are the National Family Health Survey (NFHS) and the Unified District Information System for Education (U-DISE).
NFHS, conducted by the International Institute for Population Sciences (IIPS), tracks everything from contraceptive use to anaemia, child stunting, and women’s empowerment. NFHS-5 was a landmark round.
U-DISE is the country’s main school-education data system, capturing enrolment, dropout rates, infrastructure, and teacher data.
This article explains how each operates, what NFHS-5 revealed, and how U-DISE Plus has evolved into a real-time data backbone for the National Education Policy 2020 era.
Read here: NFHS and U-DISE Statistics
Part 14: Employment Statistics: The PLFS Era
Before 2017, India relied on the quinquennial Employment-Unemployment Survey conducted by NSSO. Today, the Periodic Labour Force Survey (PLFS) runs annually for rural areas and quarterly for urban areas, providing much faster employment data.
This article covers the PLFS sampling design, key indicators (Labour Force Participation Rate, Worker Population Ratio, Unemployment Rate), the difference between Current Weekly Status and Usual Status, and the criticisms that have emerged around its methodology.
Read here: PLFS: Periodic Labour Force Survey of India

What you will master in Module 4: The structure of the Indian Census, the difference between SRS and CRS, the methodology of NFHS and U-DISE, and the modern employment data system built around PLFS.
Module 5: New Trends and Global Standards
Statistics does not end at India’s borders. Every official statistic that India produces must align with global standards set by the United Nations, the International Monetary Fund, and other international bodies.
NITI Aayog publishes the SDG India Index every year, ranking states and union territories on their progress toward the United Nations Sustainable Development Goals. When Kerala consistently leads or another state lags, the ranking is not arbitrary commentary. It is a structured measurement built on indicators sourced from MoSPI, central ministries, and state agencies. The framework you will study in this module powers that ranking, and similar frameworks across health, education, and environmental policy.
This is where modern questions are increasingly being framed in the UPSC ISS paper.
Part 15: NSSO Surveys: Methodology and Recent Rounds
The National Sample Survey Office (NSSO) has been India’s gold-standard household survey agency for over seventy years. From consumption expenditure to land holdings to health expenditure, NSSO rounds shape policy decisions across every ministry.
This article walks through the stratified multi-stage sampling design, the difference between central sample and state sample, and the most recent rounds, including the long-awaited Household Consumption Expenditure Survey 2022-23.
Read here: NSSO Surveys: Methodology and Recent Rounds
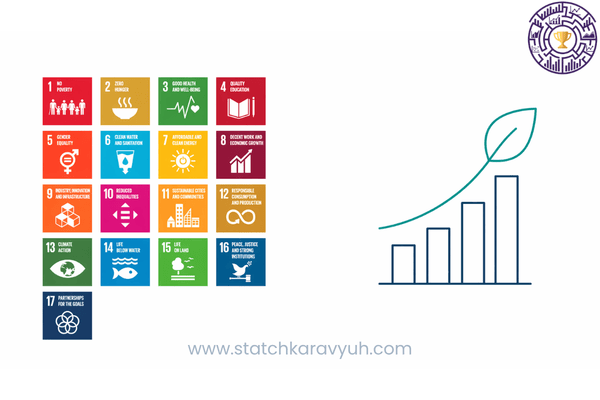
Part 16: Global Goals: SDGs and Environmental Accounting
In 2015, the United Nations adopted the 17 Sustainable Development Goals (SDGs) with 169 targets and over 230 indicators. India produces an annual SDG India Index through NITI Aayog, drawing data from MoSPI, ministries, and states.
This article also introduces environmental accounting: how India measures green GDP, natural capital, and ecosystem services as part of the System of Environmental Economic Accounting framework.
Read here: SDGs and Environmental Accounting
Part 17: The Future and the Ethics: UN FPOS and Modernization
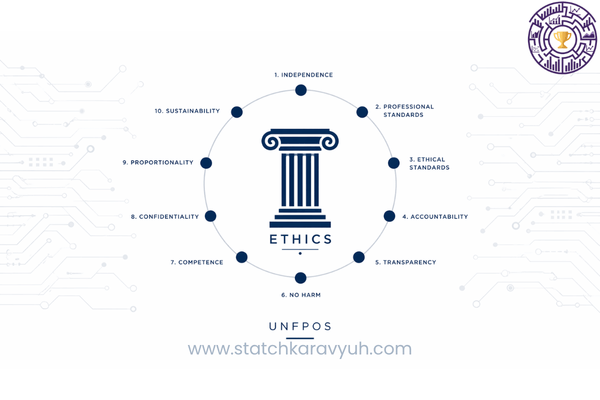
The United Nations Fundamental Principles of Official Statistics (UN FPOS) are ten principles that govern every national statistical office in the world. The principles cover impartiality, confidentiality, transparency, and international coordination.
This article explains all ten principles in plain English, shows how India aligns with them, and discusses the modernisation push: artificial intelligence in statistics, big data integration, real-time dashboards, and the National Data and Analytics Platform (NDAP).
Part 18: Environmental and Administrative Accounting: Valuing Nature, Unlocking Data
Beyond GDP, the world is moving toward valuing nature (forests, water, biodiversity) and using administrative data (GST records, EPFO data, income tax returns) for statistical purposes. India is now exploring both pathways aggressively.
This article explains how administrative data, when properly anonymised, can supplement or even replace traditional surveys, and how environmental accounts are slowly entering India’s national accounts framework.
Read here: Environmental and Administrative Accounting

What you will master in Module 5: The methodology of NSSO surveys, the SDG framework and India’s reporting structure, the UN Fundamental Principles, and the modernisation initiatives shaping the future of Indian official statistics.
Module 6: The Ultimate Revision
You have reached the final module. By now you understand the system, the laws, the economy, the people, and the global frameworks.
What you need now is structured revision. Past UPSC ISS papers show a consistent pattern. Questions on agency-data mapping, base year revisions, and the differences between similar surveys recur year after year. Candidates who memorise these mappings during revision often score significantly higher than those who try to learn methodology fresh in the final week. Use this module to lock in those high-yield facts.
Part 19: Final Revision: The Important Formula Cheat Sheet
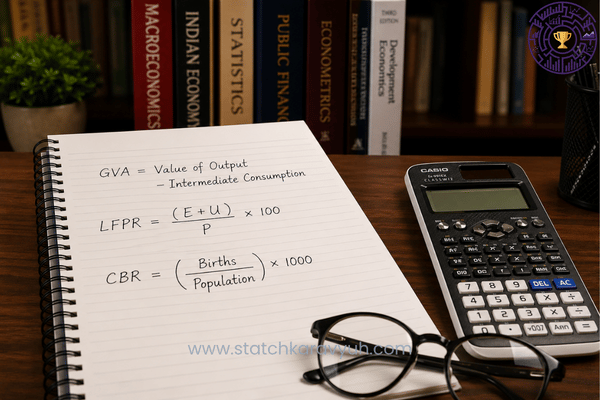
Every formula you will need on exam day, consolidated in one place. Index numbers (Laspeyres, Paasche, Fisher), demographic rates (Crude Birth Rate, Crude Death Rate, Infant Mortality Rate, Total Fertility Rate), GDP at factor cost versus market price, deflators, and growth rate formulas.
Print this page. Stick it on your wall.
Read here: Official Statistics Formulas for UPSC ISS
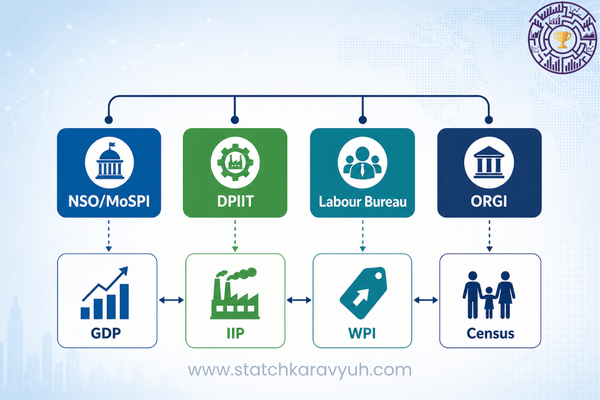
Part 20: Summary of Agencies: Who Releases What?
The most asked question pattern in the UPSC ISS paper is the one about agency mapping: “Which agency releases X?”
This summary gives you a clean mapping. MoSPI releases GDP and IIP. NSO conducts NSSO surveys. RBI releases monetary indicators. IIPS conducts NFHS. The Office of the Registrar General of India conducts the Census and the Sample Registration System. And so on.
A two-minute read on exam morning will lock all of this in for life.
Read here: Summary of Agencies Releasing Official Statistics
What you will master in Module 6: Every essential formula and every agency-to-data mapping you need on exam day.
How to Study Official Statistics for UPSC ISS Effectively
Reading twenty articles is one thing. Retaining and applying the content is another. Here is the approach that actually works for serious aspirants.
Make agency cards. Take a sticky note for each agency: MoSPI, NSO, NSSO, RBI, IIPS, ORGI, NSC, ISI. Write its full form, its key release, and its latest report. Stick them on your study wall. Within a week, your recall improves dramatically.
Build a single timeline. Many topics in Official Statistics for UPSC ISS connect to specific milestones: the Mahalanobis era, the 1951 Census, the Rangarajan Commission reports of 2001 and 2005, the Collection of Statistics Act 2008, the merger of CSO and NSSO into NSO in 2019, NFHS-5 from 2019 to 2021, the launch of PLFS in 2017. Plot all of them on a single horizontal timeline.
Use the funnel method. Read each article three times. The first read is for understanding (slow, no notes). The second read is for retention (medium speed, with handwritten notes). The third read is for revision (fast, only your notes).
Practise with previous year questions. Pull the last five to seven years of UPSC ISS Objective Paper II and tag every Official Statistics question to a module above. You will quickly see which topics repeat and where to spend extra time.
Stay updated. Subscribe to the MoSPI press releases and follow the PIB MoSPI handle. Recent data points such as the latest CPI reading, the latest GDP growth rate, and key NFHS-5 findings are the easiest source of one-mark questions in the exam.
Common Mistakes UPSC ISS Aspirants Make
Five mistakes appear again and again in candidates who score below their potential.
One: confusing GDP with GVA. GVA is the value added at the producer level, excluding net taxes on products. GDP at market price equals GVA at basic prices plus net taxes on products. Memorise this relationship cold.
Two: ignoring the Collection of Statistics Act. It is short, factual, and high-scoring. Many candidates skip it because it looks dry. Do not be one of them.
Three: mixing up CPI series. There are several CPI series in India: CPI Combined (the main RBI anchor), CPI for Industrial Workers, CPI for Agricultural Labourers, and CPI for Rural Labourers. Each has a different base year and a different agency. Tabulate them clearly.
Four: relying on outdated PLFS knowledge. PLFS replaced the old Employment-Unemployment Survey in 2017. Do not quote five-yearly EUS data in your answers. That era is over.
Five: neglecting the global side. UN FPOS, SDG indicators, and the SEEA framework are now firmly inside the syllabus. Module 5 is non-negotiable.
Recent Updates Worth Tracking
Official Statistics is a living subject. The exam rewards candidates who stay current. Some recent developments worth tracking carefully:
The Household Consumption Expenditure Survey 2022-23 results were released after a long gap, providing fresh insights into rural and urban consumption patterns and updating the foundation for poverty estimates.
The National Family Health Survey 5 brought significant findings on fertility, anaemia, women’s empowerment, and child nutrition. Subsequent rounds are expected to follow a more frequent schedule.
The Periodic Labour Force Survey continues to release annual reports along with quarterly urban bulletins, providing the most timely view of India’s employment situation.
The National Data and Analytics Platform (NDAP) launched by NITI Aayog has emerged as a unified portal for government datasets, making cross-ministry data accessible in standardised formats.
Discussions on base year revisions for GDP and CPI are active. Any base year update will likely become a high-priority exam topic for the next two cycles.
The Census 2021 remains pending. When it is finally conducted, it is expected to incorporate digital enumeration and self-enumeration features for the first time in Indian history.
Following these developments through MoSPI press releases and NITI Aayog publications gives you a meaningful edge on exam day.
Frequently Asked Questions
What is Official Statistics in the UPSC ISS exam?
Official Statistics is a section within the UPSC ISS Objective Paper II, accounting for one-fourth of the paper. It tests your understanding of India’s statistical system, including the institutions that produce data, the laws governing data collection, the methodology behind major economic and social indicators, and the global frameworks that India aligns with.
How many marks does Official Statistics carry in the UPSC ISS exam?
The Official Statistics section contains 20 multiple-choice questions, each worth 2.5 marks, for a total of 50 marks. Negative marking applies for incorrect answers.
How important is the Official Statistics paper in UPSC ISS?
Extremely important. It is one of the most scoring sections because the syllabus is finite and well-defined. Candidates who prepare systematically using a structured guide such as this one routinely score very high on this section.
What is the difference between MoSPI and NSO?
MoSPI is the ministry at the top of India’s statistical system. The NSO is the executive arm of MoSPI, formed in 2019 by merging the Central Statistics Office and the National Sample Survey Office. Think of MoSPI as the policy and authority layer, and NSO as the operations layer that does the actual statistical work.
What is the difference between GDP and GVA?
Gross Value Added (GVA) is the value of goods and services produced minus the cost of inputs and raw materials used. Gross Domestic Product (GDP) is GVA plus net product taxes (taxes on products minus subsidies on products). India publishes GDP at market price and GVA at basic price as the two headline figures.
What is the difference between CPI and WPI?
CPI measures retail-level price changes faced by consumers and is the inflation indicator the RBI uses for monetary policy. WPI measures wholesale-level price changes and is more useful for tracking producer inflation. CPI includes services in its basket; WPI does not.
What is the difference between SRS and CRS?
The Civil Registration System (CRS) is the legal, universal system for registering every birth and death in India. The Sample Registration System (SRS) is a large sample-based survey that estimates demographic indicators such as Crude Birth Rate, Crude Death Rate, Infant Mortality Rate, and Total Fertility Rate, particularly useful where CRS coverage is still incomplete.
Which book is best for Official Statistics for UPSC ISS?
There is no single textbook that covers everything. The best approach combines official MoSPI publications, the Statistical System in India book by CSO, the annual reports of MoSPI and the National Statistical Commission, and curated guides such as this pillar series. The blog series linked above is designed to be exactly that one-stop resource for candidates.
What is the latest in the Periodic Labour Force Survey?
PLFS is now released both annually (covering rural and urban areas) and quarterly (for urban areas only). The most recent annual report tracks indicators such as Labour Force Participation Rate, Worker Population Ratio, and Unemployment Rate by gender, age, and sector.
What is the UN FPOS?
The United Nations Fundamental Principles of Official Statistics are ten principles adopted by the UN Statistical Commission and endorsed by the UN General Assembly. They cover impartiality, professional ethics, transparency, confidentiality, and international cooperation. Every member country, including India, is expected to align its statistical system with these principles.
How often is the Census of India conducted?
Once every ten years. The last completed Census was in 2011. The 2021 Census was delayed due to the COVID-19 pandemic and operational reasons. The next round is being prepared with a digital-first approach.
What is the NDAP?
The National Data and Analytics Platform, launched by NITI Aayog, is a unified portal that brings together government datasets from across ministries in standardised formats. It is one of the most significant modernisation initiatives in Indian official statistics in recent years.
Final Word: Your Path to Mastering Official Statistics
If you have read this page from top to bottom, you have already done what most aspirants never do. You have seen Official Statistics for UPSC ISS as one connected story rather than twenty isolated topics.
Here is a truth that few preparation guides will admit. The candidates who clear the UPSC ISS examination are not always the ones who study the most. They are the ones who organise their knowledge most cleanly. They know exactly where every topic fits within the larger framework. They can recall agency-survey-indicator-frequency mappings without hesitation, even under exam pressure.
That is precisely what this pillar guide is built to give you.
Pick a module. Click a link. Begin reading. Return to this page whenever you need the bigger picture. Share it with a fellow aspirant who is struggling with the same scattered information problem you faced before finding this guide.
The chakravyuh of Official Statistics is not unbreakable. You simply needed the map.
Best wishes for your UPSC ISS preparation. May your numbers always add up.
Continue Your Journey
Start with Module 1 if you are new to Official Statistics for UPSC ISS. Jump directly to Module 6 if you are in the final revision phase. Whichever entry point you choose, the structure of this guide will keep your preparation organised from start to finish.
Last updated: May 2026. Curated by the Stat Chakravyuh team for UPSC ISS aspirants.
Sources:
Join Our UPSC ISS WhatsApp Communities: statcv.in/waiss
Sir literally you have done a commendable job
Hats off to your inputs sir!
Thankyou Sir for this wonderful series
Thank you! Keep following the series and stay consistent 🚀
And Sir, the content has been incredibly helpful and well-structured, and I truly appreciate the effort you put into making these materials so engaging.
Appreciate your words! That was exactly the goal 🙏
Sir literally you have done a commendable job
Hats off to your inputs sir!
Thankyou Sir for this wonderful series!!
Thank you sir, for providing important material with simple and basic understanding, and With current updates.
You’re welcome 😊 Glad you found it helpful.