In the previous parts of our Decoding Base Year series, we tackled the Overview and the New CPI. Today, we are opening the “Black Box” of Indian GDP: The Unorganized (Informal) Sector.
For the UPSC ISS Aspirant, this is the most critical update. Why? Because nearly 90% of India’s workforce is informal, yet for the last decade, we have been measuring their output using… guesses.
The 2026 Base Year Revision (shifting to 2022-23) promises to change this. Here is the breakdown of how the methodology is shifting from “Proxy” to “Direct Evidence” and why this might change India’s growth story.
The Old Problem: The “Proxy” Trap (2011-12 Series)
How do you measure the income of a roadside chaat wala or a small repair shop that doesn’t file GST? You can’t ask them every year.
So, in the current 2011-12 Base Year, MoSPI uses the Benchmark-Indicator Method:
- The Benchmark: They measured the informal sector accurately once in 2010-11 or 2015-16 (using NSS surveys).
- The Indicator (Proxy): For every year after that, they assumed the informal sector grew at the same rate as the formal sector.
- Example: If Tata Motors (Formal) grew by 10%, we assumed the local mechanic (Informal) also grew by 10%.
⚠️ Why this Failed
This logic worked fine until… Demonetization (2016) and COVID-19 (2020). During these crises, the formal sector (Big Tech, FMCG) survived or even boomed, while the informal sector was crushed. But because we used “Formal” proxies to measure “Informal” growth, our GDP data likely overestimated the health of the economy, hiding the distress of the poor.
The New Solution: Direct Estimation (2022-23 Series)
In the new series (releasing Feb 2026), MoSPI is ditching the proxies. We are moving to Direct Estimation using two powerful new datasets.
- The Data Sources
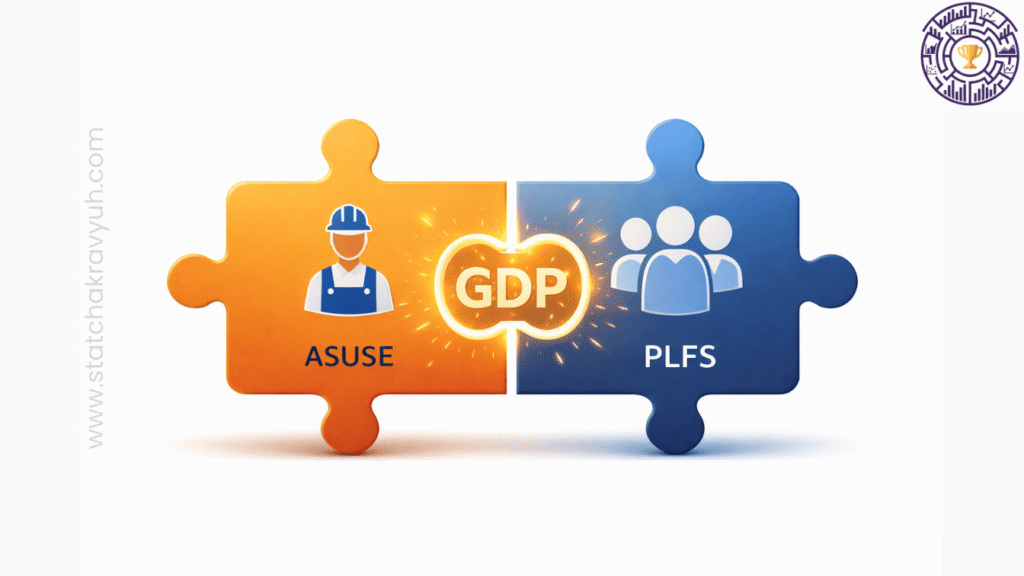
- ASUSE (Annual Survey of Unincorporated Sector Enterprises): This survey now runs annually. It tells us the “Value Added per Worker” (Productivity) of small shops and firms.
- PLFS (Periodic Labour Force Survey): This tells us how many people are actually working in the informal sector.
- The New Formula (Memorize for Paper III!)Instead of guessing, the NSO will calculate estimates annually:
GVAInformal = (Value Added Per WorkerASUSE) * (Total WorkforcePLFS)
Why is this revolutionary?
It decouples the small guy from the big guy. If the corporate sector booms but the informal sector bleeds, the new GDP data will finally show it. It captures the true “K-Shaped” reality of the economy.
The “K-Shaped” Debate: A Warning for Aspirants
This topic is hot for General Studies and Interview.
Some economists argue that when the new data comes out, we might see a drop in past GDP growth rates for years like 2017-18 or 2020-21.
- Why? Because the old method assumed the informal sector was growing. The new method might reveal it was actually shrinking.
- The Upside: While the numbers might look lower, they will be credible. This improves India’s data quality grade with the IMF (which recently gave a “C” rating due to these coverage gaps).
Source Link: mospi.gov.in
Final Summary: The Base Year Trilogy
Congratulations! You have now covered the three pillars of the 2026 Revision.
- GDP (Production): Moving to Double Deflation (Manufacturing) and Direct Estimation (Informal).
- CPI (Inflation): New Basket (2024 Base) with lower food weight and Digital Items.
- Data Quality: Aligning with SNA 2008/2025 to fix the “K-shaped” blind spot.
Next Step? Don’t let this knowledge fade. Go to our website and attempt the “Official Statistics – Base Year Special” Mock Test to check your retention!
Happy Studying, and see you on the Leaderboard!
[…] But what about the hidden informal economy? Read Part 3 here. […]